Master Bocconi Table Interpretation: 3 Worked Examples & Timed Plan

Master Bocconi Table Interpretation: 3 Worked Examples & Timed Plan
Bocconi table interpretation questions test numerical critical reasoning, not advanced math. The method stays the same every time: read the headers and units, find the exact cells the question needs, choose the right operation, calculate, then check your answer against the units and time period given. Sequential navigation and a tight clock make fast sufficiency checks and smart skipping just as important as the math itself.
TL;DR:
- Most Bocconi table questions can be solved quickly with simple arithmetic, provided you identify the correct operation based on the question type.
- Reading headers thoroughly and marking relevant cells before calculation helps prevent misreading data and reduces errors.
- Data sufficiency questions often require no calculation, only assessing whether the provided information is enough to answer the question.
- Time management is crucial because questions must be answered sequentially, and guessing or estimating is often faster than full computation.
- Practice with official mock exams using timed, no-backtracking drills improves accuracy and instinct in data interpretation under exam conditions.
Table of Contents
- Types of table and data questions on the Bocconi test
- A step-by-step method to read tables fast without misreading them
- Formulas and mental shortcuts worth memorizing
- Three worked table examples with full solutions
- Time management and navigation rules on exam day
- A short practice plan to build table-reading skill
- Reading combined data sets across tables and graphs
- What test writers do differently than you expect
- How Prepadmit fits into your table-reading practice
- FAQ
- Sources
Types of table and data questions on the Bocconi test
The Data Insights section mixes a handful of recurring formats, and spotting the format quickly tells you which operation to reach for. Bocconi’s online test places these items specifically to assess numerical critical reasoning using tables, graphs, or short passages, without requiring advanced formulas.
- Percentage change and trend comparison questions, where you compare two periods or categories.
- Ratio and proportion problems, often framed as market share or a part relative to a whole.
- Averages and weighted averages built from frequency or quantity tables.
- Data sufficiency and true-false statements that must be judged strictly on what the table shows.
- Contingency or summary tables and simple time series that combine several variables in one grid.
Each type rewards a different shortcut. Percentage change rewards quick arithmetic. Data sufficiency rewards knowing when to stop calculating because the table already answers the question, or because it never will.
A step-by-step method to read tables fast without misreading them
Most errors on these questions come from misreading a header or grabbing the wrong row, not from bad math. A fixed routine protects you from both.
- Scan the headers, units, and time period before looking at any numbers.
- Underline or mentally mark the exact cell or cells the question asks about.
- Cross out rows and columns that do not matter for this question.
- Translate the question’s words into an operation: difference, ratio, share of total, or per-unit figure.
- Check whether the figures are per period or cumulative, and whether any total is conditional on a filter in the question.
- If the table seems to lack a needed value, run a quick sufficiency check before you calculate anything.
That last step saves real time. Bocconi’s master’s program test page lists “Data Sufficiency” as its own Data Insights subtype, which means some questions are built to be answered without full computation.
Pro Tip: Read the question stem twice before touching the table: a surprising number of wrong answers come from solving the right math on the wrong target.
Formulas and mental shortcuts worth memorizing
A short list of formulas covers most table questions on this test.
- Percentage change: (new value minus old value) divided by old value, multiplied by 100.
- Weighted average: sum of each category’s value multiplied by its weight, divided by total weight, never a simple average of percentages.
- Cross-multiplication for comparing two ratios without a calculator.
- Converting any ratio to a per-100 figure for quick side-by-side comparison.
- Rounding to the nearest clean number when the answer choices are far apart, and calculating exactly only when they sit close together.
A quick gut check beats a slow recheck: when two answer choices are close, Bocconi’s test pages note that confirming your result against totals or known bounds is faster and safer than redoing the full calculation from scratch, a pattern described on Bocconi’s online test page.
Estimate when the gap between choices is wide. Calculate exactly when it is not. Guessing which situation you’re in is itself a skill worth practicing.
Three worked table examples with full solutions
These three examples mirror the formats you will meet most often: percentage change, weighted average, and sufficiency.
| Quarter | Units sold | Average price |
|---|---|---|
| Q1 | 400 | $20 |
| Q2 | 600 | $25 |
- Percentage change. Say a product’s revenue was $8,000 in Q1 and $15,000 in Q2. The change is (15,000 minus 8,000) divided by 8,000, times 100, which equals 87.5%. Sanity check: Q2 revenue is clearly less than double Q1, so an answer above 100% would be wrong.
- Weighted average. Using the table above, do not average $20 and $25. Instead, total revenue is (400 times $20) plus (600 times $25), which is $8,000 plus $15,000, or $23,000. Total units are 1,000. The weighted average price is $23,000 divided by 1,000, or $23. Averaging the two prices directly would have given $22.50, a common and avoidable error.
- Data sufficiency. Say a table shows total employees per department but not their individual salaries, and the question asks whether the average salary in Department A exceeds $50,000. Without salary figures, the table cannot answer that, regardless of how precisely you read the headcount numbers. The correct move is to mark the statement as “cannot be determined” rather than guess from unrelated figures.
Each example follows the same arc: read the exact cells, pick the operation the wording demands, compute once, then check the result against what the table structure actually allows you to know.
Time management and navigation rules on exam day
The Italian-language Bocconi test page confirms the test runs 50 multiple-choice questions in 75 minutes, with Data Insights as one of the tested areas. That is roughly 90 seconds per question on average, though table questions often need more and reading questions less.
- Sequential navigation means you cannot return to a skipped question, so decide fast: attempt, estimate, or skip.
- Build small time buffers into easier sections so harder table questions have room to breathe.
- A wrong answer and a skipped answer carry the same cost under most scoring setups, so an educated estimate usually beats leaving a question blank.
- Before confirming an answer, check units, decimal places, and whether your result actually answers the question asked.
Pro Tip: Practice with forward-only navigation, since the official instructions confirm you cannot revisit earlier questions once you move on.
A short practice plan to build table-reading skill
A focused few weeks of the right practice beats months of unstructured review.
- Spend early sessions drilling one question type at a time: percentage change one day, weighted averages the next.
- Move to mixed, timed sets once each type feels automatic on its own.
- Run full-length, timed mock sections that copy the real navigation rules, including no backtracking.
- After each mock, sort every mistake into reading errors, arithmetic errors, or misapplied formulas, since each type needs a different fix.
- Track your timed accuracy over several sessions rather than judging yourself on one mock alone.
Official past papers are the most realistic material for practicing navigation under the actual time limit. Prepadmit’s numerical reasoning guide and worked exercises with a timed mock plan are built around this same drill-then-mock structure.
Reading combined data sets across tables and graphs
Some Data Insights questions split information across two sources: a table with raw figures and a chart that shows a derived trend, or two tables that share one common category. The test rewards candidates who can line up the shared variable, usually a year, a category label, or a unit, before touching any calculation.
Start by naming the variable that connects the two sources. If a table lists revenue by region and a graph shows growth rate by year, the question is almost always asking you to combine them, for instance to estimate next year’s regional revenue from this year’s figure and the shown growth rate. Write down which source gives you the base number and which gives you the rate or share.

Watch for mismatched periods. A table might report annual totals while a graph shows quarterly change, and mixing those without adjusting the time base produces a wrong answer even when every individual calculation is correct. The same care applies to units: one source in thousands, another in millions, is a frequent trap.
When three or more data points are scattered across a table and a chart, resist the urge to use all of them. Identify exactly which two or three values the question’s wording requires, cross out the rest, and solve using only those. Bocconi’s master’s test page notes that these items often look more complex than the actual calculation required, and isolating the relevant figures is usually the fastest route to the answer.
What test writers do differently than you expect

Students under time pressure tend to use every number on the page, assuming a full table means every cell matters. Often it doesn’t. Test writers add extra rows and columns specifically to see whether you can isolate what the question actually asks.
Treat each table question as a short argument: the data are the premises, the question stem is the conclusion you need to reach. Read the stem first.
— quentin
How Prepadmit fits into your table-reading practice
Reading about percentage change and weighted averages only gets you so far. Timed, realistic repetition against official-style material is what turns the method into instinct under pressure.
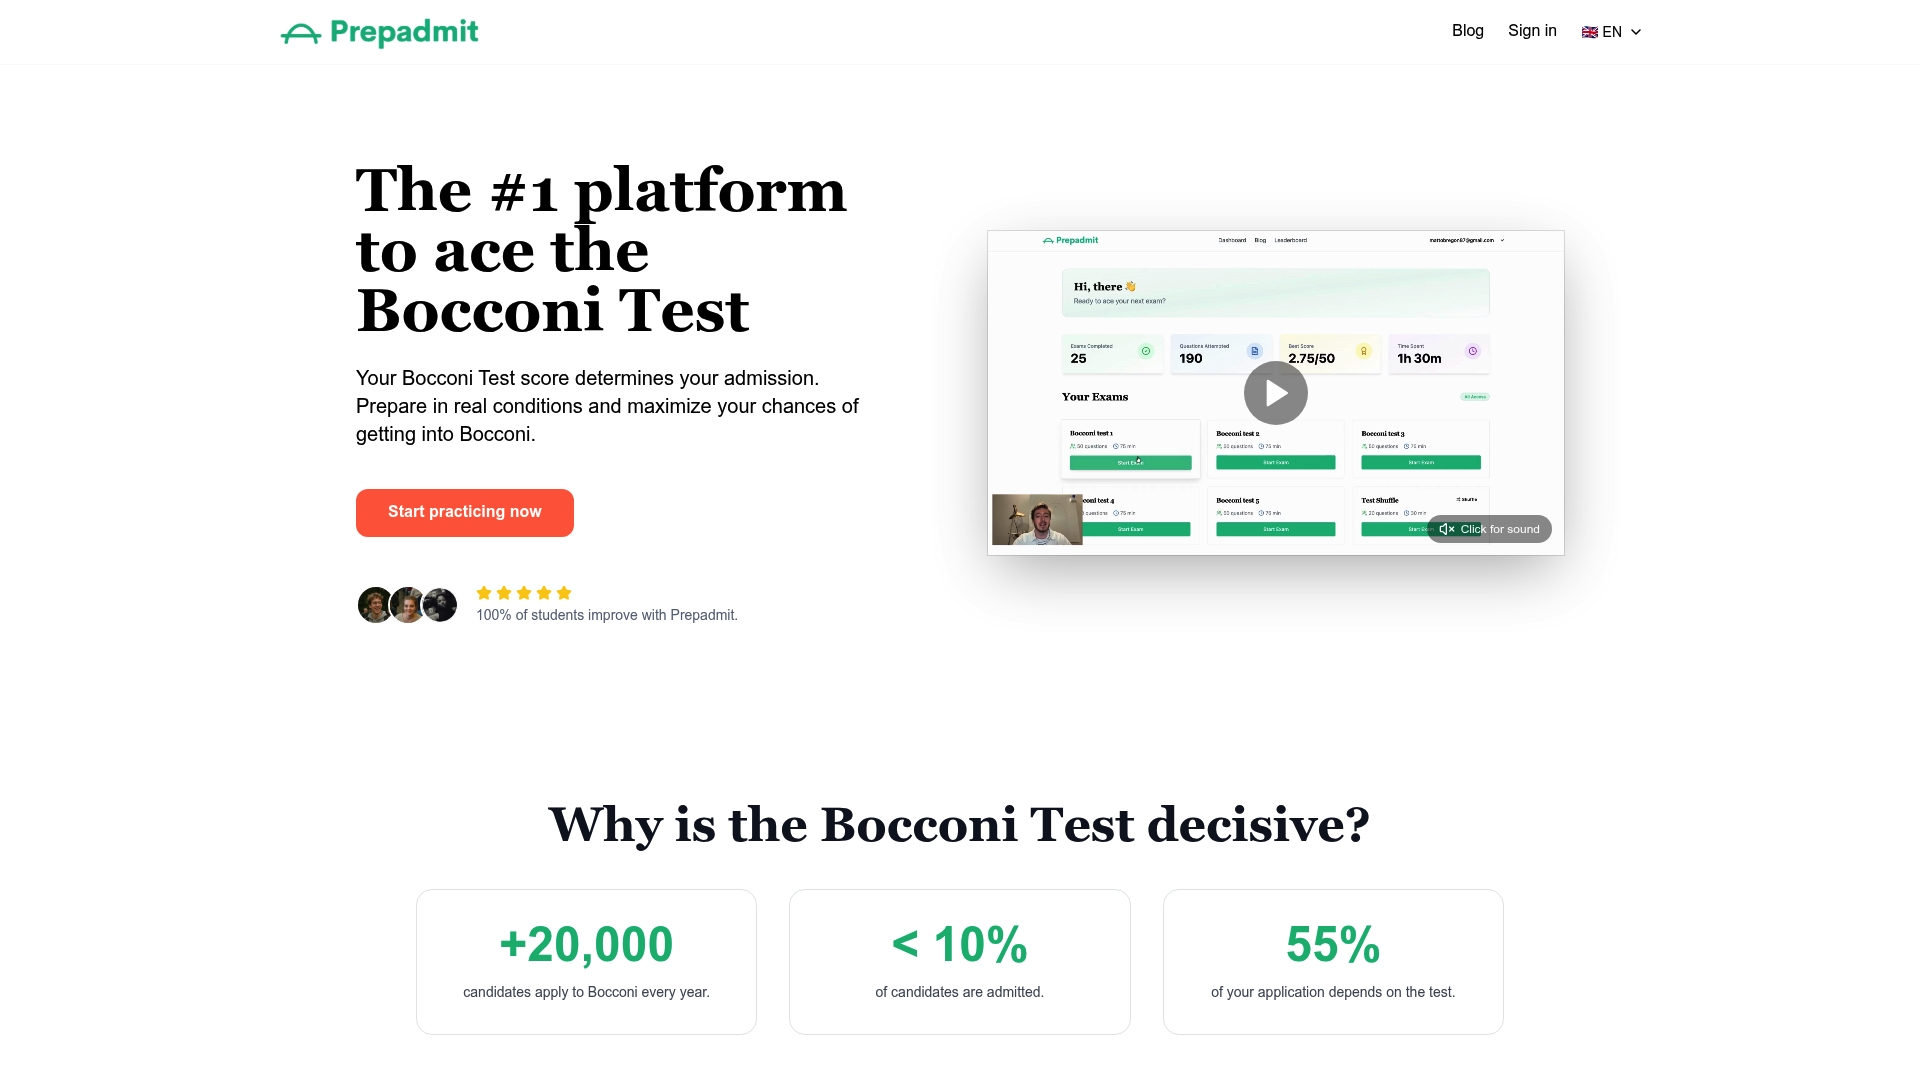
We build our practice system around official past papers rather than invented questions, with tools aimed directly at table and data interpretation:
- Simulations based on official Bocconi papers, run under the same timed, sequential navigation as the real test.
- Skill-specific drill modes, so you can isolate percentage change, weighted averages, or sufficiency questions separately.
- Detailed answer corrections that show exactly where a reading, arithmetic, or interpretation error occurred.
- Progress tracking and peer ranking, so you can see whether your timed accuracy is improving session to session.
| Study step | What it covers |
|---|---|
| Diagnostic | Baseline accuracy and timing across question types |
| Focused drills | One table question type at a time, untimed |
| Timed mock | Full section under real navigation rules |
| Error review | Mistakes sorted by reading, arithmetic, or formula |
Access the full preparation system at Prepadmit and move from reading about the method to practicing it under real conditions.
FAQ
What is the grading system at Bocconi University?
Bocconi’s own test pages describe the test as multiple-choice with a defined number of questions and a fixed time limit, but they do not publish a universal grading scale across all programs. Scoring details vary by program and admissions cycle, so check the specific program’s page on Bocconi University’s site for the exact rules that apply to your application.
Is there a course in mathematical statistics at Bocconi University?
Bocconi’s teaching pages list statistics courses covering descriptive statistics, hypothesis testing, and applied data analysis at the undergraduate and graduate level. These courses explain why the admission test’s data questions emphasize interpretation and reasoning over memorized formulas.
How many questions are on the Bocconi Data Insights section?
The official Italian-language test page confirms the full online test has 50 multiple-choice questions in 75 minutes, with Data Insights as one tested area among others. The exact split of questions per area can vary by program, so check your specific program’s test instructions.
Can I go back to a previous question on the Bocconi test?
No. The official instructions and rules confirm the test uses strict sequential navigation, so once you move forward you cannot return to an earlier question. This is why deciding quickly whether to attempt, estimate, or skip matters more than it would on a test that allows review.
What is the best way to practice Bocconi table questions?
Timed drills on one question type at a time, followed by full mock sections under real navigation rules, build both accuracy and speed. Some platforms offer official-paper simulations and skill-specific drill modes built around this exact structure.
Recommended
Related articles
Ready to ace your admission test?
Discover PrepAdmit, the platform that helps you succeed at top university admission tests.
Discover PrepAdmit