Bocconi Prep ROI Indicators: Your 2026 Guide

Bocconi Prep ROI Indicators: Your 2026 Guide
Bocconi prep ROI indicators are metrics that quantify how effectively your test preparation translates into higher admission scores and better ranking chances. Because the Online Bocconi Test counts for 55% of the admission decision, every point of score improvement carries more weight than almost any other variable you can control. Tracking the right metrics, not just logging study hours, is what separates students who gain admission from those who prepare just as hard but fall short. This guide breaks down the specific, measurable indicators you need to monitor, and shows you how to use them to get the most from your preparation investment.
1. Score improvement per practice attempt
The single most direct Bocconi return on investment indicator is your score trajectory across timed mock exams. If your score is not rising after four to six weeks of structured practice, your prep method is not working, regardless of how many hours you have spent. Track your raw score on every attempt, then calculate the average gain per session. A flat or declining curve is a signal to change your approach, not to study harder using the same method.
Pro Tip: Record not just your total score but your score by section after every mock. Section-level data tells you exactly where your ROI is weakest.

2. Negative scoring budget per section
Tracking wrong answers per section to manage your penalty exposure is one of the highest-leverage ROI indicators available. The Bocconi test applies a penalty of minus 0.25 for every incorrect answer, with zero deducted for blanks. This means a student who attempts 40 questions with 10 wrong scores the same as a student who attempts 30 questions with zero wrong. Reducing your wrong-answer rate by even five percentage points can outperform adding five more attempted questions with poor accuracy.
| Section | Recommended max wrong answers | Reason |
|---|---|---|
| Math/Quantitative | 3 to 4 | Lower penalty risk per attempt |
| Reading/Critical Thinking | 2 to 3 | Higher penalty impact per wrong |
| Verbal/Logic | 2 to 3 | Guessing rarely pays off here |
3. Accuracy rate by question type
Accuracy rate is the percentage of attempted questions you answer correctly, measured separately for each question type. A student with 80% accuracy on math but 50% accuracy on verbal reasoning has a clear, actionable signal: verbal is where prep investment will generate the most ROI. Generic “study more” advice ignores this. Prepadmit’s skill-specific practice modes are built precisely to surface these gaps so you can direct effort where it pays off most.
4. Time per question by section
The Online Bocconi Test gives you 75 minutes for 50 questions, which averages 90 seconds per question. But that average is misleading because some sections reward speed while others reward careful reading. Track your actual time per question by section during every timed mock. If you are spending 150 seconds on verbal questions and rushing math, your pacing is misaligned with your strengths, and your score is paying the price.
5. Skip rate and its effect on your score
Your skip rate, the proportion of questions you leave blank, is a direct prep ROI metric that most students ignore entirely. Skipping too few questions means you are likely incurring unnecessary penalties. Skipping too many means you are leaving guaranteed points on the table. The optimal skip rate depends on your accuracy level in each section. If your accuracy on a question type is below 60%, skipping is almost always the better financial decision given the minus 0.25 penalty structure.
“The best ROI improvements in penalty-based exams come from section-specific decision rules, not from studying more content.”
6. Baseline diagnostic score
Without a pre-training benchmark, you cannot prove improvement, and you cannot calculate ROI. Your baseline diagnostic score, taken under real timed conditions before any structured prep, is the starting point for every other metric in this list. Take a full timed mock on day one of your preparation. Record your total score, section scores, accuracy rates, skip rates, and time per question. This single data point makes every subsequent measurement meaningful.
Pro Tip: Use the same test format for your baseline as for your progress checks. Mixing timed and untimed mocks produces data that cannot be compared.
7. Score gain per prep hour invested
This is the metric that connects your effort to your outcome in the most direct way possible. Divide your total score improvement by the total hours you have invested in structured practice. A student who gains 8 points in 20 hours of focused mock-based practice has a stronger ROI than one who gains 10 points across 60 hours of passive content review. The ROI formula is straightforward: net benefit divided by total cost, multiplied by 100. For test prep, net benefit is score improvement and total cost includes both fees paid and time invested.
8. How to track baseline and ongoing progress
Measuring Bocconi educational returns starts with a structured tracking system, not a spreadsheet of hours studied.
- Take a full timed diagnostic mock before any prep begins to set your baseline across all four sections.
- After every practice session, log your section score, accuracy rate, skip count, and average time per question.
- At the four-week mark, run a second full timed mock and compare every metric against your baseline.
- At the eight-week mark, run a third full mock. If your score gain is flattening, shift your focus to the section with the weakest accuracy improvement.
- Use mock exam analytics to identify recurring error patterns, not just total wrong answers.
The goal is to build a performance portfolio across attempts, not to chase a single perfect score. Prepadmit’s progress tracking feature does this automatically, ranking your performance against peers so you can see where you stand relative to other applicants.
9. Why strategy beats raw study hours
The most counterintuitive finding in Bocconi ROI analysis is that tactical decision-making under timed pressure improves scores more reliably than additional content study. Here is why.
- The penalty system means that a wrong answer costs you 1.25 points relative to a skip (you lose 0.25 instead of gaining 1.00). Every reckless guess is a double loss.
- Guessing in math-style questions can be neutral when you can eliminate two or three options. In reading and critical thinking, the same guess is statistically negative.
- Students who practice real-time decision rules, specifically when to attempt, when to skip, and when to guess, consistently outperform students who study the same content without that tactical layer.
- Tracking your skip-to-attempt ratio per section is itself a prep ROI metric. If that ratio is not shifting toward your optimal range over time, your tactical training is not working.
Pro Tip: Simulate the penalty system during every practice session. Never practice without scoring yourself with the real minus 0.25 rule. Practicing without penalties trains the wrong instincts.
10. Comparing prep approaches through an ROI lens
Not all preparation methods deliver the same return per hour or per dollar. Here is how the main options compare when measured against Bocconi program indicators.
| Prep method | Direct cost | Time cost | Score gain potential | ROI quality |
|---|---|---|---|---|
| Self-study with free materials | Low | High | Moderate | Low to moderate |
| Paid test prep programs | Moderate | Moderate | High | High |
| Private coaching | Very high | Low | High | Low (cost-adjusted) |
| Mock exam platforms (e.g., Prepadmit) | Low to moderate | Low | High | Very high |
Prep costs include both fees and time, not just the price of a course. Private coaching may accelerate improvement, but at a cost per point gained that rarely justifies itself when structured mock platforms deliver comparable score gains at a fraction of the price. Prepadmit reports an average score improvement of 34% among its users, which is a concrete ROI benchmark to compare against any alternative.
Pro Tip: When evaluating prep costs, calculate cost per point of score improvement, not just the sticker price of the program.
11. Leading vs. lagging ROI indicators and your study timeline
Understanding the timing of metric improvements is what allows you to plan your prep schedule intelligently.
- Leading indicators are the early signals. Accuracy gains within a specific section and faster time per question typically appear within two to four weeks of focused practice. These tell you your tactical training is working before your total score reflects it.
- Lagging indicators are the outcome metrics. Overall composite score improvements typically manifest within 60 to 90 days of consistent practice. Do not panic if your total score is flat in week three. Check your section accuracy instead.
- The four-attempt allowance means you can treat each attempt as a data point in a portfolio. Model your retakes as investments: what incremental score gain are you targeting per attempt, and what prep change will produce it?
- Start early enough to complete at least two full feedback cycles before your target attempt date. Each cycle is four to eight weeks of practice followed by a full timed mock.
The students who use all four attempts strategically, adjusting their prep focus between each one based on measured indicators, consistently outperform those who treat each attempt as an isolated event.
Key takeaways
Measuring ROI for Bocconi prep requires tracking accuracy, penalty exposure, and time per question, not hours studied, because these metrics directly map to the scoring system that determines 55% of your admission outcome.
| Point | Details |
|---|---|
| Score improvement is the primary ROI metric | Track total and section scores across every timed mock to measure real progress. |
| Penalty management beats volume | Reducing wrong answers per section improves scores more reliably than attempting more questions. |
| Baseline data is non-negotiable | Take a full timed diagnostic before prep begins so every later metric has a reference point. |
| Leading indicators appear in weeks | Accuracy and timing gains show up in two to four weeks; total score gains take 60 to 90 days. |
| Retakes are portfolio investments | Plan each of your four allowed attempts around a specific incremental score target. |
Why I think most students measure the wrong things
I have seen students log 80 hours of prep and walk into the Bocconi Test with no idea how many wrong answers they can afford per section. They feel prepared because they feel busy. That feeling is not a metric.
The single biggest unlock I have observed is when a student shifts from tracking hours to tracking their negative scoring budget. Once you know that three wrong answers in the critical thinking section costs you 0.75 points and that skipping those three questions costs you nothing, your entire approach to the exam changes. You stop trying to answer everything and start making deliberate decisions.
Retakes deserve the same reframe. A second attempt is not a sign of failure. It is a second data point in your portfolio. The students who treat their first attempt as a diagnostic, analyze every section metric afterward, and adjust their prep accordingly, are the ones who close the gap on their second or third try.
The metric that matters most is not your score on any single attempt. It is your score improvement rate across attempts. If that rate is positive and you have attempts remaining, you are on the right path. If it has flatlined, something in your prep method needs to change, and the section-level data will tell you exactly what.
— quentin
Start tracking your Bocconi prep ROI with Prepadmit
If you are serious about measuring and improving your Bocconi Test performance, you need a platform built around the metrics that matter.
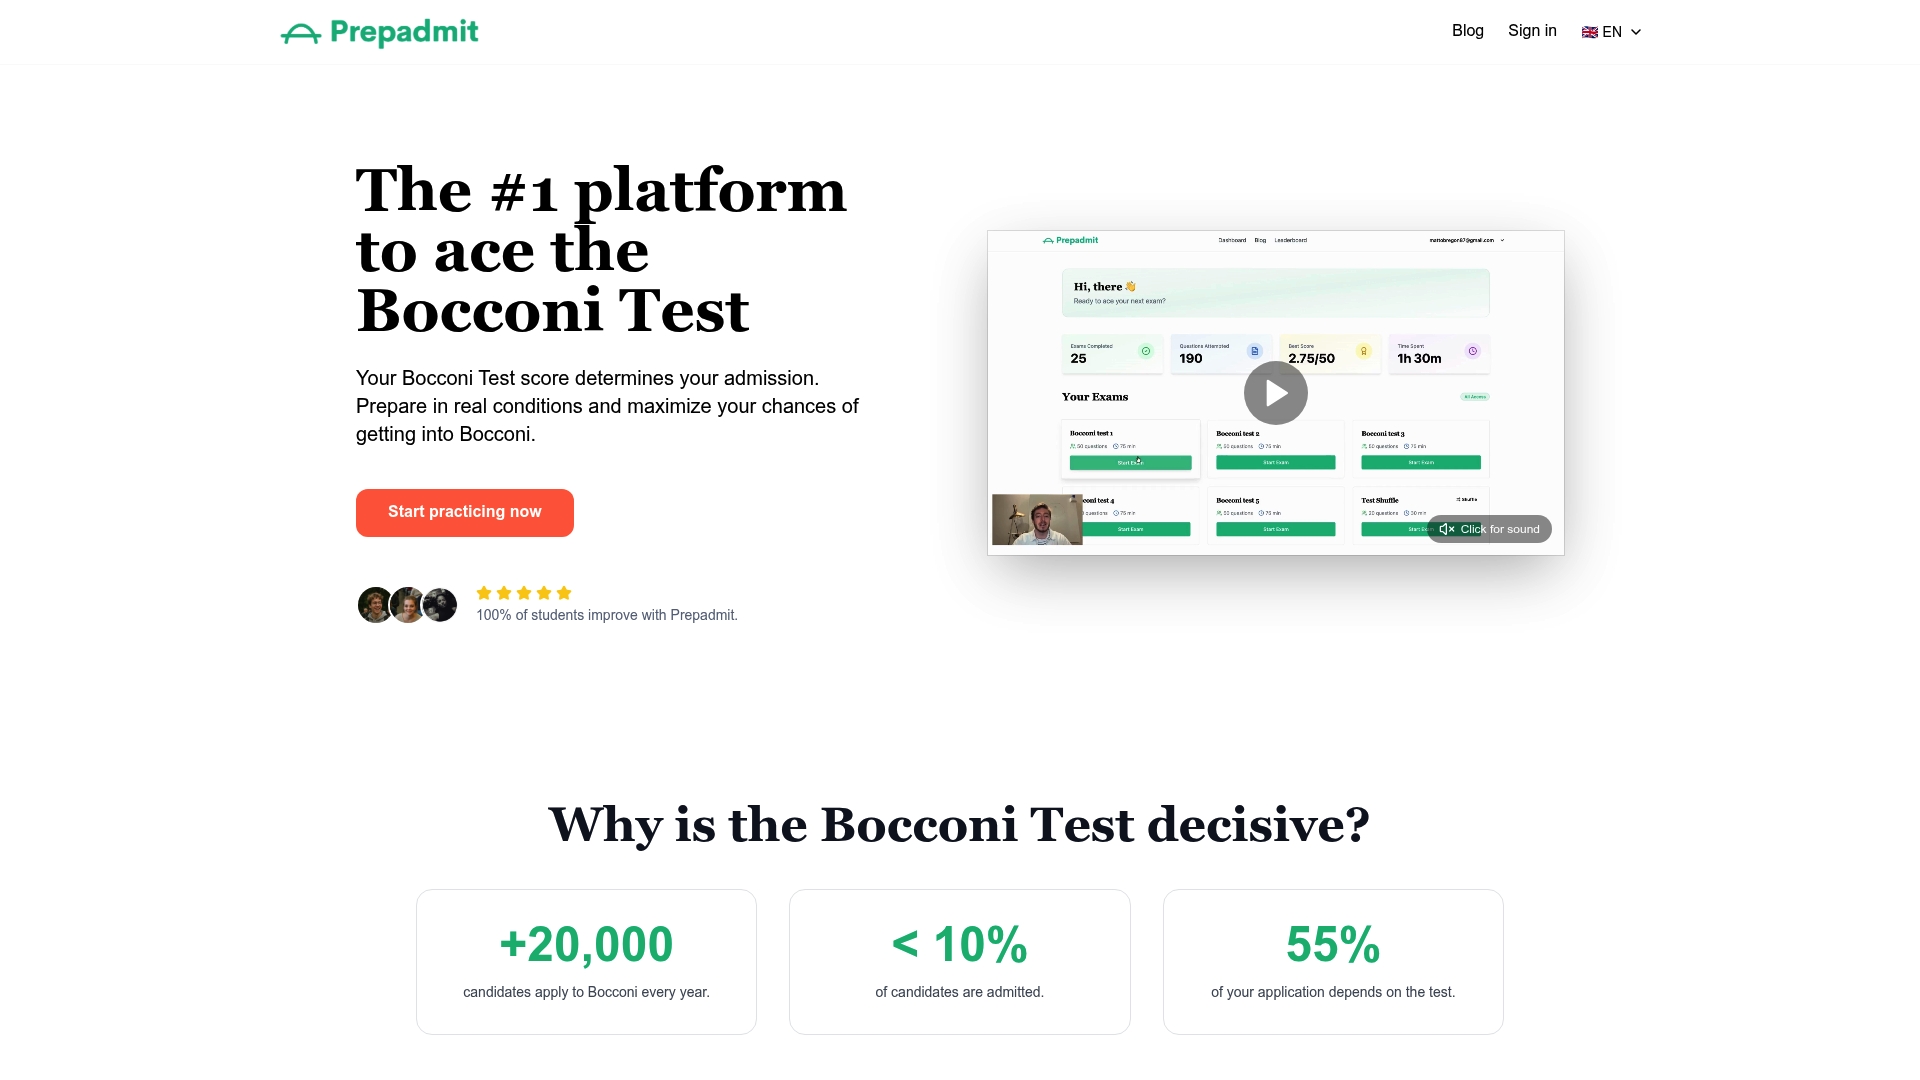
Prepadmit is designed specifically for Bocconi Test preparation, with timed mock exams that replicate real test conditions, section-level analytics that surface your accuracy and penalty exposure, and progress tracking that shows your improvement curve across every attempt. The platform was built by experts from HEC and Bocconi, and its users see an average score improvement of 34%. That is a concrete ROI benchmark. Start your preparation on Prepadmit today and turn your study time into measurable score gains.
FAQ
What are the most important Bocconi prep ROI indicators?
The top indicators are section-level score improvement, accuracy rate per question type, time per question by section, and wrong-answer rate. These metrics map directly to Bocconi’s scoring system and predict admission outcomes more reliably than total hours studied.
How does the Bocconi penalty system affect my ROI calculations?
The test applies a minus 0.25 deduction for every wrong answer and zero for blanks. This means your wrong-answer rate is a direct cost in your ROI calculation. Reducing incorrect answers in low-accuracy sections often produces a higher score gain than attempting more questions.
How many times can I take the Bocconi Test?
You can take the Online Bocconi Test up to four times. Each attempt should be treated as a strategic investment, with a specific incremental score target and a prep adjustment based on your previous attempt’s section-level data.
When should I expect to see ROI improvements in my prep?
Leading indicators like accuracy gains and faster time per question typically appear within two to four weeks. Overall composite score improvements, the lagging indicators, generally take 60 to 90 days of consistent practice to materialize.
Is paid test prep worth the cost for Bocconi?
Yes, when measured on a cost-per-point-of-improvement basis. Structured mock platforms and paid programs consistently outperform free self-study on ROI because they provide the analytics and feedback loops needed to identify and fix specific weaknesses faster.
Recommended
Related articles
Ready to ace your admission test?
Discover PrepAdmit, the platform that helps you succeed at top university admission tests.
Discover PrepAdmit