Turn 75 Minute Mocks Into Bocconi Progress With Error Tagged Drills

Turn 75 Minute Mocks Into Bocconi Progress With Error Tagged Drills
Progress tracking for the Bocconi Test means logging three numbers after every practice session: your penalty-aware net score, your section-by-section breakdown, and your average time per question. Skip the vague “I felt good about that mock” impression. A credible prep platform can automate the logging and chart the trend lines for you, but even a spreadsheet works if you record the same three metrics every time.
TL;DR:
- Tracking net score, section breakdowns, and time per question consistently allows you to identify strengths and weaknesses effectively.
- Setting weekly goals based on baseline mock scores helps target your weakest sections and improve pacing in specific areas.
- Full timed mocks that mirror the actual 50-question, 75-minute exam are essential for measuring true progress under pressure.
- Analyzing error tags by category reveals whether issues stem from concepts, carelessness, misreading, or time management, guiding precise drills.
- Using platforms with automatic scoring and dashboards accelerates progress tracking and provides structured, reliable improvement data.
Table of Contents
- What Metrics Should You Track After Every Bocconi Practice Session?
- How Do You Turn Baseline Data Into Weekly Goals?
- How Do You Run a Bocconi Mock That Actually Produces Useful Data?
- How Do You Read Your Error Patterns and Turn Them Into Drills?
- What Should a Bocconi Progress Tracker Actually Include?
- What I Learned Tracking My Own Bocconi Practice Data
- Let Prepadmit Handle the Tracking While You Focus on the Studying
- Sources
What Metrics Should You Track After Every Bocconi Practice Session?
Your net score is the number that matters, and it is not the same as your raw correct count. The official Bocconi scoring gives you +1 for a correct answer, −0.25 for a wrong one, and 0 for a blank. Guess your way through 10 questions and get half wrong, and you have quietly erased more than you gained. Track the net score, not the percentage correct.
Beyond the headline number, break every mock down into these categories:
- Sectional scores for mathematics, critical thinking, numerical reasoning, and reading comprehension, logged separately so you can see which one is dragging the average down.
- Timing metrics, specifically average seconds per question and how time is distributed across sections. Are you burning four minutes on one geometry problem and rushing the last ten reading questions?
- Error tags for each miss: conceptual gap, careless slip, misread question, or time pressure. A wrong answer without a tag is a wasted data point.
- A consistent logging method, either a spreadsheet template with columns for date, section, net score, time per question, and error type, or a platform dashboard that fills those fields automatically.
The format matters less than the consistency. A messy log kept every single session beats a beautiful one abandoned after week two.
How Do You Turn Baseline Data Into Weekly Goals?
Run one full mock before you touch a single study plan. Its purpose isn’t to feel good, it’s to give you a number to improve against. Compute the penalty-aware net score, then break it down by section using the categories above. This baseline becomes the zero point for every goal you set afterward.
From there, measurable, week-over-week objectives beat vague intentions like “get better at math.” Here’s a workable four-week structure:
- Week 1: Baseline mock, then target closing the single weakest section by 2 to 3 net points using 15 to 20 focused drills.
- Week 2: Second mock. Compare the section you drilled against week one, and add a time-per-question target, aiming to shave five to ten seconds off your slowest section.
- Week 3: Shift focus to your second-weakest section while maintaining week 2’s gains through 10 minutes of daily maintenance drills.
- Week 4: Full timed mock under real conditions. Compare net score, section breakdown, and time-per-question against week 1.
If your baseline shows strong accuracy but slow pacing, prioritize speed drills. If accuracy is the problem, slow down and drill concepts before you touch a timer again.
How Do You Run a Bocconi Mock That Actually Produces Useful Data?
A mock test only generates trustworthy data if it mirrors the real exam. The official Bocconi test runs 50 questions in 75 minutes, and a 40-question practice set with no clock tells you almost nothing about how you will perform under real pressure.
Universities’ own preparation guides recommend a staged approach to time training: start untimed to build correct methods, move to section-timed drills once the concepts are solid, then graduate to full 75-minute simulations. Skipping straight to timed mocks before you understand why you get questions wrong wastes the exercise.
Before you sit any full mock, check these boxes:
- Quiet environment, same device you plan to use on test day, and a visible timer running the full 75 minutes.
- Consistent rules for marking uncertain answers (guess, skip, or flag) so your data is comparable mock to mock.
- A read-through of the official rules of conduct so your practice conditions match what is actually enforced on test day.
- A full mock evaluation that logs a detailed correction sheet and a time map, not just a final score.
Simulations built around official-format questions remain the single most reliable source of progress data because they replicate both the timing and the mix of question types you will actually face.
How Do You Read Your Error Patterns and Turn Them Into Drills?
Not every wrong answer means the same thing, and lumping them together is how students plateau for weeks without knowing why. Split your misses into four categories: conceptual (you didn’t know the rule), careless (you knew it and rushed), misread (you answered the wrong question), and time pressure (you got there too late to think clearly).
Once you have a few mocks logged, prioritize drills using frequency times score impact, not just raw error count. A section where you miss five questions on a topic worth heavy point value outranks a section where you miss five scattered, low-weight questions.
Here’s the workflow:
- Tag every error in your log by category and section, right after each mock while the reasoning is fresh.
- Rank error types by how often they appear and how many net points they cost you.
- Build a micro-drill of 10 to 25 questions targeting only your top-ranked error type. A focused set of timed math drills works better here than another generic full-length mock.
- Re-measure after the micro-drill using the same tagging system, checking whether that specific error category shrank.
- Re-run a full mock only every two to three micro-drill cycles, since full mocks are for verifying overall progress, not for daily error correction.
Pro Tip: If the same error tag keeps showing up after two full drill cycles, the problem probably isn’t the topic. It’s how you’re studying it. Switch the drill format, not just the content.
What Should a Bocconi Progress Tracker Actually Include?
A dashboard is only as useful as the fields it forces you to fill in. Look for these features whether you build your own spreadsheet or use a dedicated platform:
- Trend charts showing net score over time, not just a single test result.
- Per-question logs that record time spent and whether the answer was right, wrong, or skipped.
- Section breakdowns that isolate math, critical thinking, numerical reasoning, and reading comprehension.
- Time maps that show pacing across the full 75 minutes.
- Drill modes that let you isolate a single error category for focused practice.
- Peer ranking, used carefully. Peer ranking provides motivation and a relative signal, but it’s noisy and should never replace your own net-score trend as the real measure of progress.
- Exportable logs so you can review history even if you switch tools.
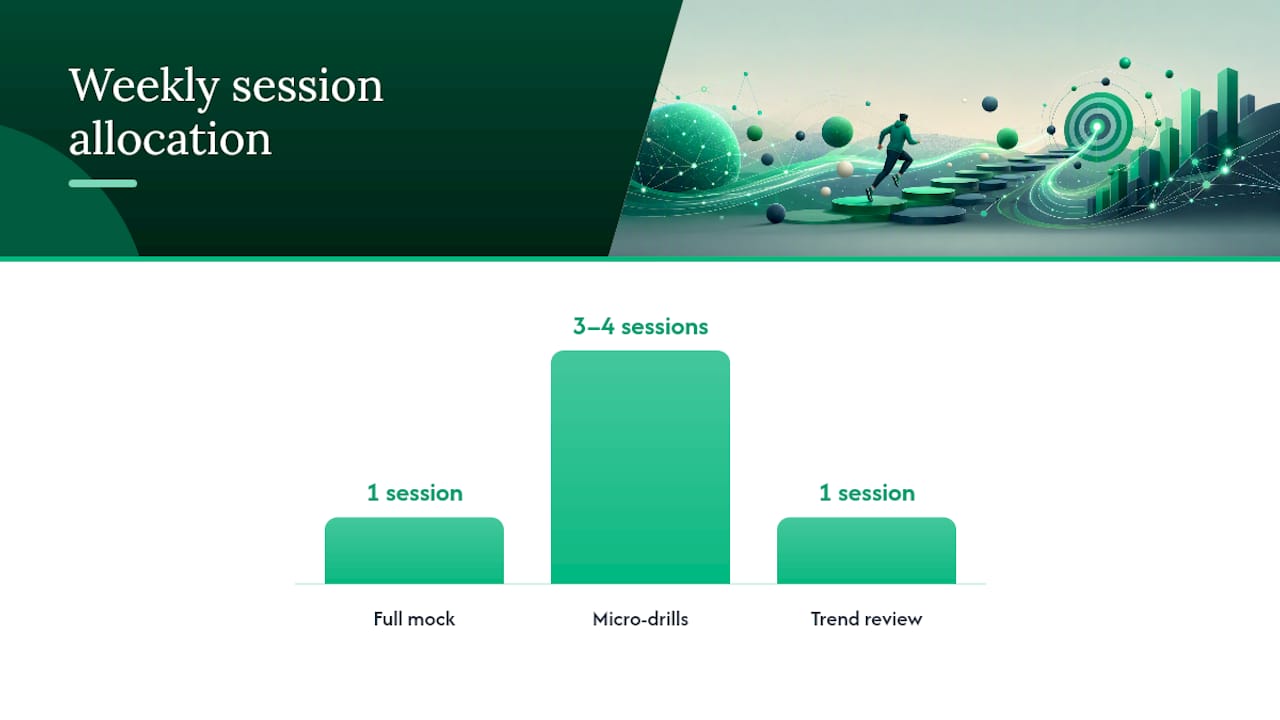
A workable weekly rhythm: run one full mock, spend three or four sessions on targeted micro-drills based on that mock’s error tags, and check your trend chart at the end of the week. You’re looking for a declining error rate paired with a flat or rising net score. If the chart moves sideways for two straight weeks, that’s your signal to change the drill, not push harder on the same one.
Some students using structured practice systems often see notable score improvements, based on official past papers developed by a team with backgrounds from reputable institutions.
Platforms built around official past papers and realistic simulations tend to produce exactly this kind of usable data, since the corrections and dashboards are already structured around net score, timing, and section breakdowns.
What I Learned Tracking My Own Bocconi Practice Data
The biggest surprise in my own tracking wasn’t a weak section. It was discovering that my “strong” section, numerical reasoning, was quietly losing points to careless errors under time pressure, not conceptual gaps. The raw score looked fine. The error tags told a different story.
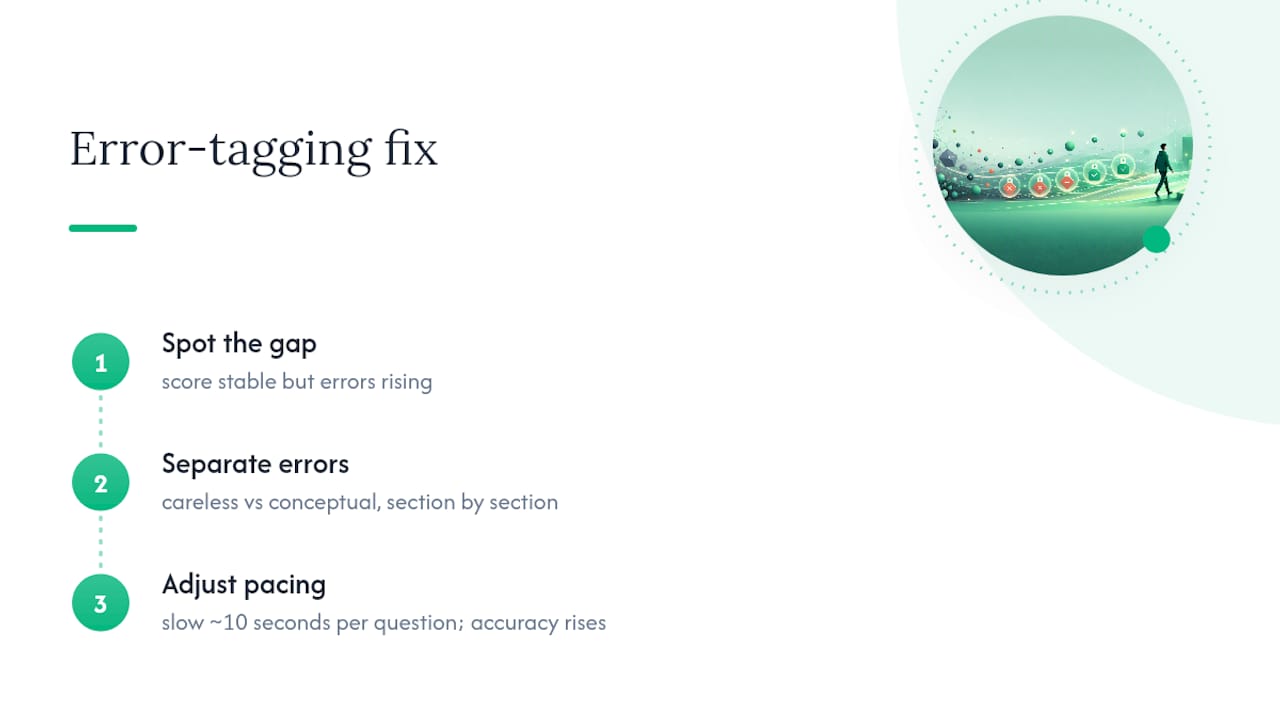
That’s the gap most students miss: a stable overall score can hide a section that’s one bad week away from collapsing. Once I separated careless errors from conceptual ones, the fix was obvious. I slowed down on that section by roughly ten seconds per question and let accuracy climb instead of chasing speed everywhere at once.
The takeaway is simple. Don’t just track whether your score is going up. Track why it moved, section by section, error by error. That’s the only data that tells you what to do next.
— quentin
Let Prepadmit Handle the Tracking While You Focus on the Studying
Building your own spreadsheet works, but it takes hours you could spend on actual drills. There are platforms that serve as alternatives to private tutors or homemade tracking sheets for Bocconi Test prep. Such platforms provide official-format mocks, automatic net-score calculation with the real +1/−0.25/0 rules, and dashboards that chart your trend without manual calculations.
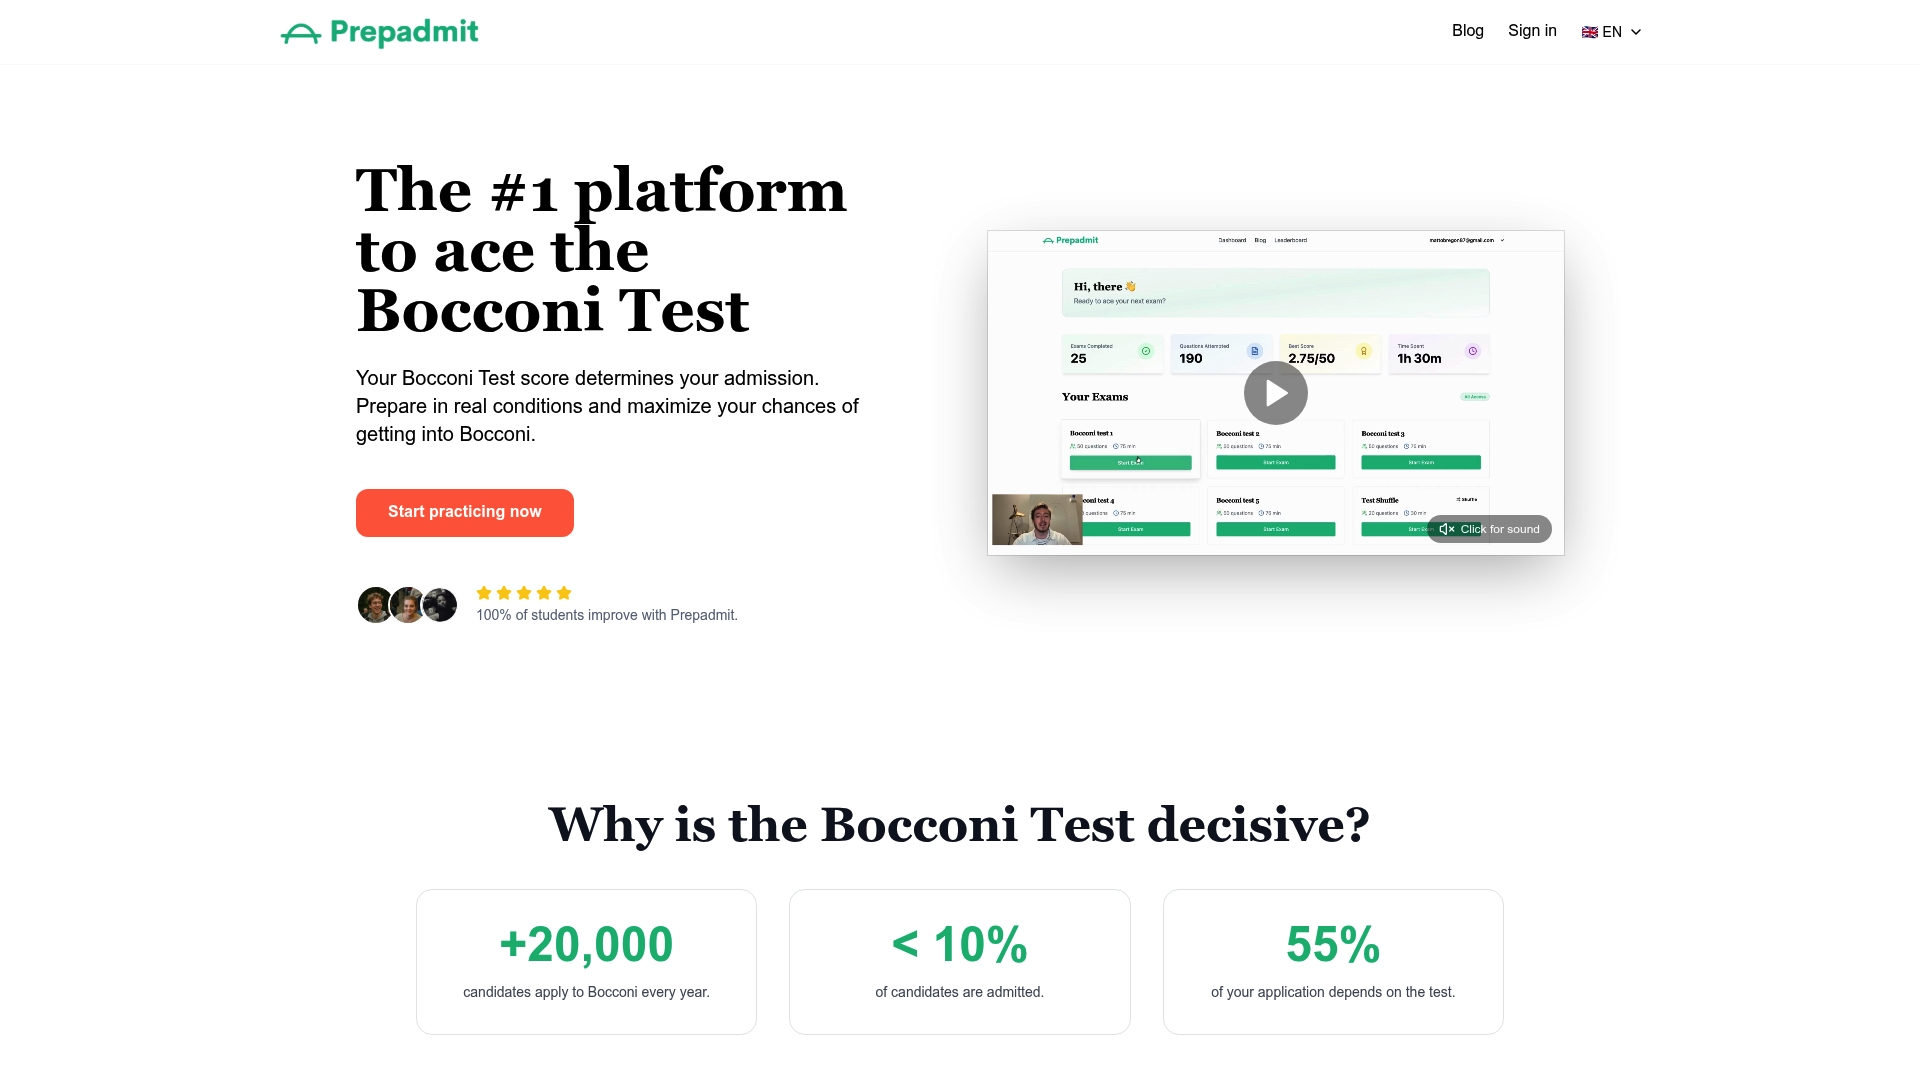
The platform maps directly onto the workflow above: official past papers for realistic mocks, detailed corrections that tag exactly where you lost points, progress dashboards with trend charts and time maps, and a peer ranking leaderboard to see where you stand against other applicants. Prepadmit backs its system with a money-back guarantee and reports an average score lift of 34% among students who train with it.
If you want to see how the tracking and drill system works before committing, check the step-by-step preparation guide or head straight to Prepadmit’s platform to start your first official-format mock.
Sources
- Online Bocconi test | Bocconi University
- Test di ammissione all’università : come prepararsi con metodo nel 2026
- Test di ammissione: come funzionano e come prepararsi - Università.it
Recommended
Related articles
Ready to ace your admission test?
Discover PrepAdmit, the platform that helps you succeed at top university admission tests.
Discover PrepAdmit