Bocconi Prep ROI Calculation: A Data-Driven 2026 Guide

Bocconi Prep ROI Calculation: A Data-Driven 2026 Guide
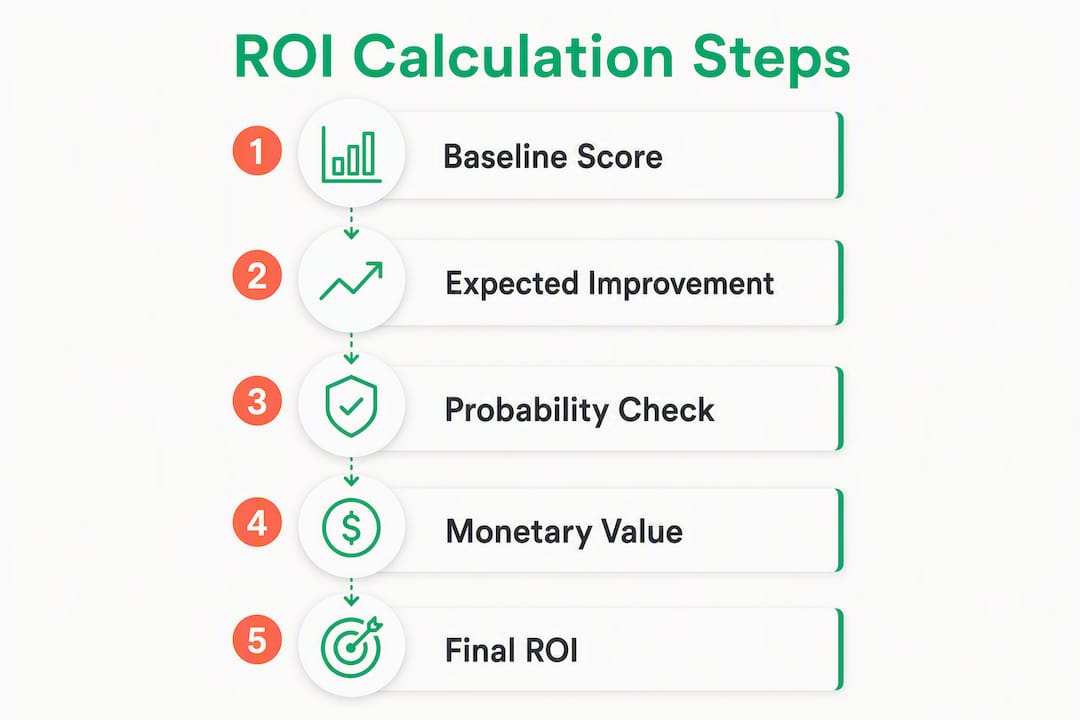
The Bocconi prep investment ROI calculation follows one formula: ROI = (Estimated monetary value of score gain − Total prep cost) ÷ Total prep cost × 100. For a student who spends a typical amount on a prep platform, gains enough points to cross a scholarship threshold worth a significant annual amount, and has a moderate probability of achieving that gain, the expected value is positive. That is a positive ROI before you factor in avoided retake fees. Buy the prep.
The expected-value variant matters more than the headline ROI number. Expected value = (Estimated monetary value × Probability of achieving it) − Total prep cost. A $2,000 course promising a 5% chance of a $10,000 scholarship gain has an expected value of −$1,500. The math says no, regardless of how compelling the marketing sounds.
Score gains carry outsized weight at Bocconi. The university assigns 55% of its admissions decision to the test score, making it the single largest controllable variable in your application.
Scholarship thresholds amplify this further. Moving from a mid-range score to a threshold that unlocks a merit award can be worth tens of thousands of euros across a four-year degree. Retake fees add a second monetary layer: each additional Bocconi Online Test attempt requires a full registration payment, plus potential currency conversion and international transaction charges. Treating those costs as part of your prep ROI calculation changes the break-even point significantly.
Worked example using Prepadmit’s reported average improvement: Prepadmit reports an average score improvement of 34% across its platform users. Assume a prep cost of $300, a score gain that raises scholarship probability by 34%, and a scholarship value of $6,000 per year ($24,000 over four years). Expected value = ($24,000 × 0.34) − $300 = $7,860. ROI = $7,860 ÷ $300 × 100 = 2,620%. Even under conservative assumptions, the math favors structured prep decisively.

Pro Tip: Run the expected-value calculation twice: once with the vendor’s stated average improvement as your probability input, and once with half that figure as a stress test. If the ROI is still positive at half the claimed effect size, the purchase is low-risk.
| Input | Conservative | Base Case | Optimistic |
|---|---|---|---|
| Prep cost | average amount | average amount | average amount |
| Scholarship value (annual) | moderate value | moderate value | moderate value |
| Years of award | several years | several years | several years |
| Probability of gain | low-moderate | moderate | moderately high |
| Expected value | moderate | high | very high |
| ROI | positive | strongly positive | very strongly positive |
Table of Contents
- How do you measure score improvement per practice attempt?
- Why your baseline diagnostic needs to be more than one test
- How many study hours does it take to gain one point?
- How does negative scoring affect your expected value per question?
- Which question types give you the highest ROI per study hour?
- How does pacing affect your score, and how do you improve it?
- How should you track progress to compute real-time ROI?
- Which prep approach gives you the best ROI for your situation?
- What are the leading indicators that your prep is working?
- How does Prepadmit’s tracked data change your ROI calculation?
- Three fully worked ROI scenarios for Bocconi prep
- What should you measure before buying prep, and when does the math say yes?
- Key Takeaways
- A practitioner’s honest take on Bocconi prep ROI
- How to run your ROI calculation using Prepadmit
- Sources, templates, and further reading
How do you measure score improvement per practice attempt?
Tracking score trajectory across timed mocks is how you convert raw study effort into a number the ROI formula can use. Without a trajectory, you are guessing at your probability of improvement.
Log these fields after every full-length timed mock:
- Date and test type (full mock vs. targeted section drill)
- Raw score and scaled score
- Section breakdown (verbal, quantitative, logical reasoning, or whichever sections apply to the Bocconi format you are practicing)
- Timed vs. untimed flag
- Brief notes on conditions (fatigue, distractions, time of day)
Build a simple trajectory chart by plotting scaled scores on the y-axis and mock number on the x-axis. A linear trendline gives you a projected score at your test date. A conservative projection uses the slope of your worst three consecutive mocks rather than your best.
| Column | What to record |
|---|---|
| Date | Test date |
| Test type | Full mock / section drill |
| Scaled score | Overall |
| Section scores | Per-section raw and scaled |
| Study hours since last mock | Cumulative |
| Intervention type | New material / review / timed drill |
| Notes | Conditions, errors, patterns |
Pro Tip: Smooth out single-session variability by using a three-mock rolling average rather than the most recent score. One bad day can distort your trajectory and lead to a premature strategy change.
The trajectory slope is your leading indicator for the ROI calculation. A flat or negative slope after four or more mocks signals that your current approach is not converting study hours into points, which means your expected value is deteriorating in real time.
Why your baseline diagnostic needs to be more than one test
A single timed diagnostic is not a defensible baseline. One test captures too much noise: test-day fatigue, unfamiliar format anxiety, and random question variance can each shift your score by several points in either direction. Your entire ROI calculation rests on this number, so it needs to be reliable.
The recommended protocol:
- Complete 2–3 full-length, official-format diagnostics using official past papers or high-fidelity simulations.
- Space them at least 48 hours apart to avoid fatigue carryover.
- Match real test conditions: timed, no interruptions, same time of day as your scheduled exam.
- Log environmental variables (sleep hours, stress level, location) for each session.
- Take the median score across all diagnostics as your baseline. If scores vary by more than 10%, take the weighted average, giving more weight to the most recent session.
Baseline diagnostic checklist:
- At least 2 full-length mocks completed before declaring a baseline
- Official past papers or platform-verified high-fidelity sims used (see step-by-step prep guide for format details)
- Timed conditions matched to the actual test
- Median or weighted average calculated, not a single result
- Baseline score logged with date and conditions
A shaky baseline inflates your apparent score gain and therefore your calculated ROI. If your diagnostic was taken untimed or on a low-effort day, your ROI math will look better than it actually is, and you will overpay for prep you may not need.
How many study hours does it take to gain one point?
Points-per-hour is the efficiency metric that connects your time investment to the ROI formula. Calculate it as: total points gained ÷ total study hours logged between diagnostics.
If you gained 12 points over 40 hours of focused study, your efficiency rate is 0.30 points per hour. That figure lets you estimate how many hours you need to reach a target score and compute cost-per-point for any prep option you are evaluating.
| Study window | Hours invested | Points gained (optimistic) | Points gained (base) | Points gained (conservative) |
|---|---|---|---|---|
| 4 weeks | 40 | 15 | 10 | 6 |
| 8 weeks | 80 | 25 | 17 | 10 |
| 12 weeks | — | — | — | 13 |
Efficiency tends to decline after the first 60–80 hours as easy gains get captured and harder skills require more repetition. Budget for that curve rather than projecting a flat rate across a 12-week window.
Cost-per-point comparison works like this: a $300 platform that produces 17 points costs $17.65 per point. A $150/hour tutor who produces 10 points over 5 sessions costs $75 per point. The platform wins on cost-per-point by a factor of four, even if the tutor produces slightly higher absolute gains. Fold this into your prep-approach comparison before committing to either.
How does negative scoring affect your expected value per question?
The Bocconi Online Test applies a penalty for wrong answers, which means skipping a question is not always the conservative choice. The expected value per question depends on how many answer choices exist and your estimated accuracy on that question type.
Expected value per question formula: EV = (Probability of correct × Points for correct) + (Probability of wrong × Penalty for wrong)
For a 5-choice question with +1 for correct and −0.25 for wrong, and a 25% accuracy rate (random guess): EV = (0.25 × 1) + (0.75 × −0.25) = 0.25 − 0.1875 = +0.0625. Random guessing is slightly positive in this scenario. At 20% accuracy (below random), EV turns negative and skipping is correct.
| Accuracy on question type | EV per attempt (5-choice, −0.25 penalty) | Decision |
|---|---|---|
| 20% | −0.25 | Skip |
| 25% | +0.0625 | Guess |
| 40% | +0.30 | Attempt |
| 60% | — | Attempt confidently |
Negative-scoring budget: Calculate how many risky guesses you can afford per section by setting a floor on your expected section score. If you need 70% of available points to hit your target, and you have 10 uncertain questions remaining, the budget math tells you exactly how many to attempt versus skip.
The ROI implication is direct: targeted practice on question types where your accuracy sits between 20% and 40% yields the highest marginal return. Moving accuracy from 25% to 40% on a high-frequency question type can add several net points with relatively few practice hours.
Which question types give you the highest ROI per study hour?
Not all question types are equal. Some appear frequently, carry full point weight, and respond quickly to targeted practice. Others are rare, require deep background knowledge, and yield slow improvement. Allocating study time without a priority matrix is one of the most common ways students underinvest in high-leverage areas.
How to build your priority matrix:
- Run a full diagnostic and record your accuracy rate for each question category.
- Estimate the frequency of each category in the actual test (number of questions).
- Multiply accuracy gap (target minus current) by frequency to get a raw priority score.
- Rank categories by priority score and allocate study blocks accordingly.
| Question type | Current accuracy | Target accuracy | Frequency (approx.) | Priority score |
|---|---|---|---|---|
| Logical reasoning | 45% | 70% | High | High |
| Quantitative reasoning | 60% | 80% | High | Medium-high |
| Verbal comprehension | 55% | 75% | Medium | Medium |
| Data interpretation | 35% | — | Medium | High |
| General knowledge | 70% | — | Low | Low |
Logical reasoning and data interpretation tend to be high-ROI targets for most students: they appear frequently, accuracy improves with structured practice, and the skills transfer across multiple question formats. A 20-percentage-point accuracy gain on a high-frequency type can translate to 4–6 net points on a full mock, which at a 0.30 points-per-hour efficiency rate requires roughly 13–20 hours of focused work.
To convert improved accuracy into monetary value, multiply the expected additional points by the marginal scholarship probability per point, then multiply by the annual scholarship value. Even a rough estimate clarifies whether a 20-hour investment in a specific question type is worth more than 20 hours of general review.
How does pacing affect your score, and how do you improve it?
Pacing problems cost points in two ways: running out of time leaves questions unanswered, and rushing through questions raises error rates. Both reduce your expected score without any change in underlying knowledge.
How to measure your current pacing:
- During a timed mock, log the time remaining at the end of each section.
- Divide total section time by the number of questions to get your average time per question.
- Compare against the target time per question for each section (total section time ÷ question count).
- Identify sections where you consistently run over or under by more than 15%.
A short drill plan to reduce average time per question:
- Practice 10-question timed sprints at 80% of your target time per question.
- After each sprint, review every question you answered incorrectly or skipped.
- Identify whether errors came from rushing or from knowledge gaps.
- Repeat the sprint format three times per week for two weeks before reassessing.
Pacing checklist for daily practice:
- Set a per-question time target before starting each drill
- Flag questions that took more than 1.5× the target time
- Review flagged questions for pattern (topic, format, or reading load)
- Adjust time targets by section based on three-session averages
Pacing gains fold directly into the hours-to-points calculation. If a two-week pacing drill (roughly 10–15 hours) recovers 3–4 points from previously unanswered questions, your efficiency rate for that intervention is 0.25–0.40 points per hour, which is competitive with most content-review approaches.
How should you track progress to compute real-time ROI?
A logging schema is only useful if you actually use it. Keep the structure simple enough to complete in under three minutes after each session.
Required spreadsheet columns:
| Column | Purpose |
|---|---|
| Date | Session date |
| Test type | Full mock, section drill, or concept review |
| Scaled score | Overall (mocks only) |
| Raw section scores | Per section |
| Study hours | Time spent this session |
| Intervention type | New material, review, timed drill, error analysis |
| Notes | Patterns, fatigue, specific errors |
Recommended checkpoint cadence:
- Baseline diagnostic: complete before any structured prep begins.
- Checkpoint 1: after 20 study hours or two weeks, whichever comes first.
- Checkpoint 2: at the midpoint of your total prep window.
- Final checkpoint: 7–10 days before the test date (no new material after this point).
At each checkpoint, recalculate your expected value using your updated score trajectory. If your slope has flattened or reversed, that is the signal to change approach, not to study harder with the same method.
Pro Tip: Prepadmit’s built-in progress dashboard tracks section scores, mock history, and peer ranking automatically. If you are already using the platform, you do not need a separate spreadsheet for score data. Reserve your manual log for study hours and intervention type, which the platform does not capture.
For a platform-versus-spreadsheet decision: use a platform dashboard when you want automated scoring, peer benchmarks, and question-level analytics. Use a spreadsheet when you need to track time allocation, intervention types, and cost-per-point across multiple prep sources simultaneously. The platform features comparison covers what Prepadmit’s dashboard tracks natively.
Which prep approach gives you the best ROI for your situation?
Three realistic prep paths exist: self-study with free resources, a private tutor, and a structured online platform. The right choice depends on your baseline, time available, and proximity to a scholarship threshold.
| Approach | Estimated cost | Expected points gained | Success probability | Estimated ROI |
|---|---|---|---|---|
| Self-study (free resources) | $0–$50 | 8–12 | 25% | Highly variable |
| Private tutor (10 sessions) | — | 12–20 | 45% | Moderate |
| Online platform (Prepadmit) | ~$300 | 15–25 (avg. 34% improvement reported) | 34% | High |
Decision guidelines:
- Self-study works when you have 12+ weeks, a strong baseline, and the discipline to follow a structured plan without external accountability. ROI is high if it works, but success probability is lower without feedback mechanisms.
- Private tutor makes sense when you have a specific, diagnosable weakness that targeted instruction can fix quickly, and when your baseline is close to a scholarship threshold. Cost-per-point is high, so the math only works if the tutor produces above-average gains.
- Online platform fits most students: structured content, tracked progress, and a cost that keeps the break-even point low. The ROI case strengthens further when the platform offers a money-back guarantee, which reduces downside risk.
Checklist for validating any vendor’s claims:
- Ask for average effect size with sample size stated
- Confirm whether the sample includes all users or only completers
- Check whether a refund policy exists and under what conditions
- Request a free diagnostic or trial session before committing
Small changes in success probability swing ROI dramatically. Moving from a 30% to a 45% probability of achieving a $20,000 scholarship gain on a $300 investment shifts expected value from $5,700 to $8,700. That 15-percentage-point difference is worth more than any cost negotiation.
What are the leading indicators that your prep is working?
Lagging indicators are final outcomes: your actual test score, admission decision, scholarship award. Leading indicators are the early signals that predict whether those outcomes are on track.
Leading indicators to track weekly:
- Mock score slope (is the three-mock rolling average trending up?)
- Hours-per-point (is your efficiency rate stable or improving?)
- Accuracy on your two highest-priority question types
- Percentage of timed mocks completed within the time limit
- Error repeat rate (are you making the same mistakes twice?)
Pivot decision rules by checkpoint:
- After Checkpoint 1 (20 hours): if your rolling average has not moved by at least 2 points, review your study method, not your effort level.
- After Checkpoint 2 (midpoint): if your trajectory projects a final score below your target, consider adding a higher-intensity intervention (platform upgrade, targeted tutor session).
- After the final checkpoint: no strategy changes. Focus on consolidation and pacing.
Timeline affects ROI in a specific way. Short prep windows (under 6 weeks) favor high-cost, high-effect interventions because there is not enough time for self-study compounding to work. Long windows (12+ weeks) favor lower-cost platforms and self-study because efficiency compounds over time and the cost-per-point drops. A student with 4 weeks before the test and a score 15 points below a scholarship threshold has a different ROI calculation than one with 14 weeks and a 5-point gap.
Red flags that justify an immediate strategy change:
- Three consecutive mocks with no score improvement
- Error repeat rate above 40% (you are not retaining corrections)
- Accuracy on high-priority question types declining rather than improving
- Consistent time-limit failures in the same section across multiple mocks
How does Prepadmit’s tracked data change your ROI calculation?
Prepadmit reports an average score improvement of 34% across its platform users. That figure is the platform’s internal benchmark, and it carries the standard caveats: it reflects users who completed the program, and individual results vary based on baseline, hours invested, and starting skill profile.
34% average score improvement reported by Prepadmit across platform users. Individual results depend on baseline score, hours invested, and consistency of practice.
Used as an input to the ROI formula, the 34% figure changes the math materially. Here is a worked example with explicit assumptions:
| Assumption | Description |
|---|---|
| Prep platform cost | Typical platform cost |
| Baseline score (scaled) | Representative starting score |
| Expected score after improvement | Improved score based on average platform gain |
| Scholarship threshold score | Target score needed for scholarship |
| Annual scholarship value | Typical scholarship amount |
| Scholarship duration | Standard duration |
| Total scholarship value | Calculated total over duration |
| Probability of achieving improvement | Estimated chance of gain |
| Expected value | Result of (Total scholarship value × Probability) − Prep cost |
| ROI | Ratio of expected value to prep cost |
Even at a lower improvement rate than the average, threshold proximity impacts ROI significantly. A student starting nearer the threshold sees a more favorable ROI calculation.
Pro Tip: Before plugging any vendor’s average improvement into your ROI model, ask whether the figure is a percentage of baseline score or an absolute point gain. A 34% improvement from a baseline of 60 means +20 points. From a baseline of 80, it means +27 points. The same percentage produces very different outcomes depending on where you start.
To update your personal expected-value model after each checkpoint, replace the vendor’s stated probability with your observed trajectory probability. If your mock scores are tracking above the platform average after four weeks, raise your probability input. If they are tracking below, lower it and recalculate whether the investment still clears your expected-value threshold.
Three fully worked ROI scenarios for Bocconi prep
These three scenarios use different inputs to show how sensitive the ROI calculation is to starting conditions. Run your own numbers by substituting your actual baseline, target score, and scholarship value.
Step-by-step formula for each scenario:
- Identify total prep cost (platform + materials + retake fees if applicable).
- Estimate monetary value of score gain (scholarship value × years, or avoided retake cost).
- Estimate probability of achieving the gain (use vendor data, then stress-test at 50% of that figure).
- Calculate expected value: (Monetary value × Probability) − Total prep cost.
- Calculate ROI: Expected value ÷ Total prep cost × 100.
| Scenario | Prep cost | Monetary value of gain | Probability | Expected value | ROI |
|---|---|---|---|---|---|
| A: Close to threshold, short window | $300 | $24,000 | 34% | $7,860 | 2,620% |
| B: Far from threshold, long window | $300 | $24,000 | 20% | $4,500 | 1,400% |
| C: Retake avoidance only | $300 | — | 70% | −$20 | −7% |
Scenario C is the important one. If your only monetary motivation is avoiding a retake fee, the ROI math barely works. The case for structured prep rests on scholarship value, not retake avoidance alone. Retake cost is a supporting argument, not the primary one.
Sensitivity notes: effect size is the most powerful input. Doubling the probability from 20% to 40% in Scenario B raises expected value from $4,500 to $9,300. Scholarship value is the second most powerful input. A student targeting a $4,000 annual award instead of $6,000 sees expected value drop by roughly $3,200 under the same probability assumptions. Cost is the least sensitive input at these scholarship values: a $300 versus $600 prep cost difference changes ROI by less than 200 percentage points when expected value is in the thousands.
To stress-test a vendor’s effect-size claim: recalculate ROI at 50% and 25% of the stated improvement. If ROI remains positive at 25% of the claimed effect, the purchase is low-risk. If it turns negative at 50%, you are betting heavily on the vendor delivering above-average results for your specific profile.
What should you measure before buying prep, and when does the math say yes?
Buy structured prep when expected value is positive and your Checkpoint 1 performance meets minimum thresholds. That is the complete decision rule.
The ROI formula is: (Estimated monetary value × Probability of achieving it) − Total prep cost. If this number is positive, the purchase is rational. If it is negative, either the cost is too high, the probability is too low, or the monetary value of the gain is smaller than you assumed.
Checklist of metrics to collect before buying:
- Baseline score (median of 2–3 timed diagnostics, not a single result)
- Target score (tied to a specific scholarship threshold or admission band)
- Scholarship value in dollars (annual award × years of eligibility)
- Total prep cost including platform, materials, and any retake fees
- Estimated probability of achieving the target gain (use vendor data, then halve it for a stress test)
- Hours available for prep before your test date
- Current accuracy rates by question type (from your diagnostic breakdown)
Two next steps: run the expected-value calculation with your real numbers before committing to any paid product. Then complete one free diagnostic on the platform you are considering to verify that the format and feedback quality match what the ROI math assumes.
Pro Tip: Avoid sunk-cost bias after you have started a prep program. If your Checkpoint 2 data shows a flat trajectory, the money already spent is gone regardless of what you do next. The only question is whether continuing the same approach is the best use of your remaining time and money.
Key Takeaways
The Bocconi prep ROI calculation is positive in most realistic scenarios when a scholarship threshold is within reach, because the monetary value of crossing that threshold dwarfs any reasonable prep cost.
| Point | Details |
|---|---|
| ROI formula | Use (Monetary value × Probability) − Prep cost; positive result means buy. |
| Test score weight | Bocconi assigns 55% of admissions weight to the test, making it the highest-leverage input. |
| Baseline reliability | Use the median of 2–3 timed diagnostics; a single session is not a defensible starting point. |
| Efficiency metric | Track points-per-hour to compare prep options; cost-per-point reveals true value faster than price alone. |
| Prepadmit benchmark | Prepadmit reports a 34% average score improvement; use this as the platform’s success probability input in the expected-value formula and stress-test at 50% of that figure. |
A practitioner’s honest take on Bocconi prep ROI
The ROI math in this article is real, and it works. But most students who run it make one consistent mistake: they treat the vendor’s average improvement as their personal probability, then feel blindsided when their trajectory diverges.
The 34% average figure from Prepadmit is a useful anchor, not a guarantee. Students who start closer to the scholarship threshold, practice consistently, and use the error-review features tend to cluster above the average. Students who purchase access and use it sporadically cluster below. The platform does not cause the improvement. The hours and the quality of review do.
A few things the math does not capture well. First, tolerance for retakes varies. Some students are willing to sit the test three times; others have a hard deadline. If you have one shot, the probability input in your expected-value calculation should be more conservative, and the case for structured prep strengthens. Second, the motivational letter and transcript together account for 45% of the admissions decision. If your test score is already competitive, additional prep hours may yield lower marginal ROI than time spent on the written components. Third, accountability structures matter more than most students expect. A study partner, a weekly check-in, or a platform with peer ranking can raise your effective probability of improvement by keeping you on schedule. That is a real input to the ROI model, even if it is hard to quantify precisely.
ROI is probabilistic. Checkpoints are how you manage that probability in real time. Treat each checkpoint as a decision point, not a progress report.
How to run your ROI calculation using Prepadmit
Prepadmit gives you the inputs the ROI formula needs before you finish your first week of prep. The platform’s progress tracking and mock exam system captures your baseline score, section-level accuracy, and score trajectory automatically, so you are not building a spreadsheet from scratch.
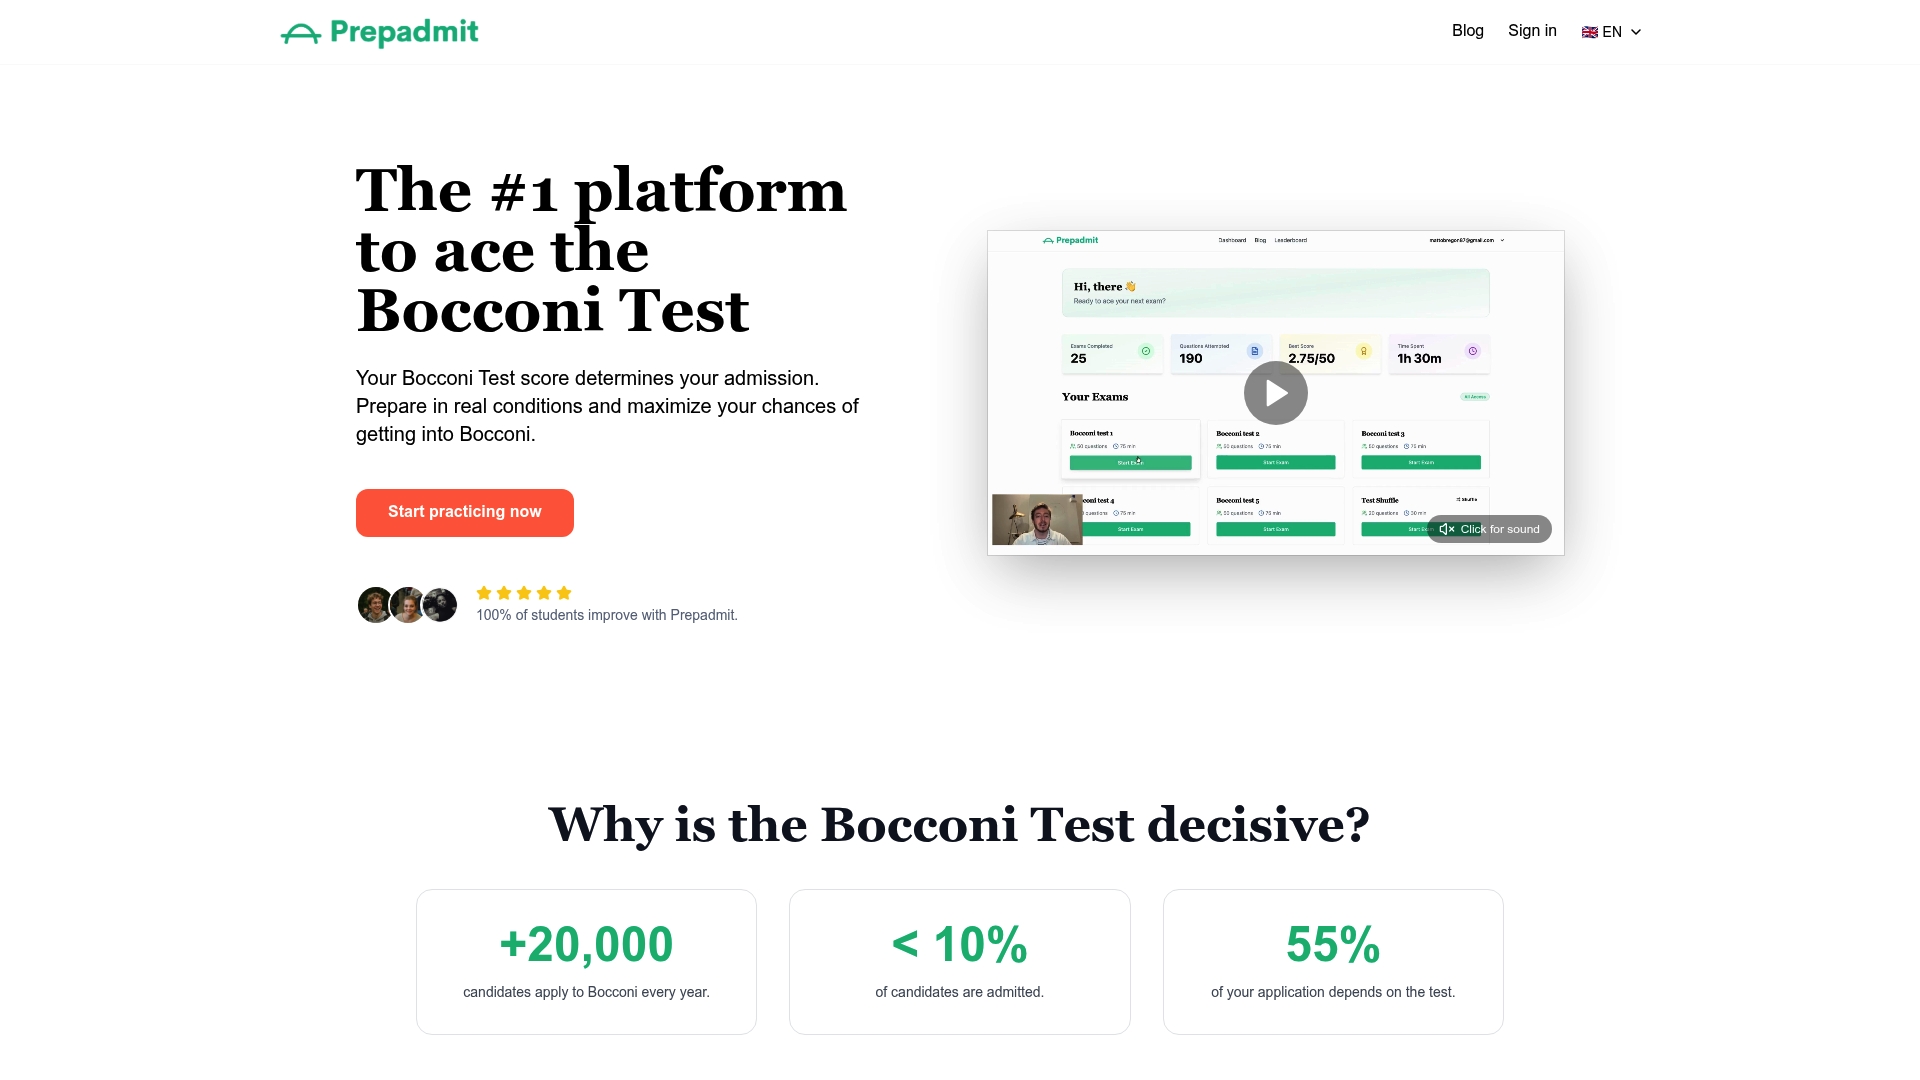
Here is how to plug Prepadmit’s data into the model. Start with a free or low-cost diagnostic to establish your baseline. After two weeks of platform use, check your rolling average score against your target. If the trajectory is on track, your probability input for the expected-value calculation is supported by real data, not a vendor’s marketing claim. Prepadmit’s reported average improvement of 34% is the starting assumption; your personal checkpoint data replaces it as evidence accumulates.
Pricing is a fraction of private tutoring costs, which keeps the break-even point low and the ROI math favorable even under conservative probability assumptions. The platform also offers a money-back guarantee, which reduces the downside risk in the expected-value calculation. Individual results vary based on baseline, hours invested, and consistency of practice.
Ready to run the numbers with real data? Start your Bocconi prep on Prepadmit and use your first two checkpoints to validate whether the ROI math holds for your specific profile. The financial aid guide for international students covers scholarship thresholds in detail, which is the monetary value input your ROI calculation needs.
Sources, templates, and further reading
The calculations in this article draw on the following sources. Each is worth reading directly for the specific section noted.
- Bocconi University — Applying to Bocconi: primary source for the 55% test-score admissions weight and retake fee structure. Read the “Selection Criteria” section before setting your target score.
- Free Test Prep Course ROI Calculator: interactive tool that accepts course cost, estimated score-gain value, study hours, and success probability as inputs and outputs ROI, expected value, and cost-per-study-hour. Use it to run the three scenarios from this article with your own numbers.
- How to Calculate ROI: Step-by-Step: covers all-in cost accounting including fees, taxes, and transaction costs; useful for building the full-cost version of the prep ROI formula.
- Bocconi Test Fees, Costs, and Rules: details on indirect costs including currency conversion and travel that should be included in your total prep cost calculation.
For the spreadsheet template: the column schema from the tracking section of this article (date, test type, scaled score, raw section scores, study hours, intervention type, notes) is the complete structure. Build it in Google Sheets or Excel, add a rolling-average formula for the scaled score column, and plot the trajectory chart from that column. The ROI formula lives in a separate tab where you input your current trajectory score, target score, scholarship value, and probability estimate.
Recommended
- International Bocconi Student Success Examples: 2026 Guide — PrepAdmit Blog
- What Is a Good Bocconi Test Score? Benchmarks and Targets for 2026 — PrepAdmit Blog
- Bocconi Test Format 2026: What Changed & How to Practice It — PrepAdmit Blog
- How to Prepare for the Bocconi Test: A Step-by-Step 2026 Guide — PrepAdmit Blog
Related articles
Ready to ace your admission test?
Discover PrepAdmit, the platform that helps you succeed at top university admission tests.
Discover PrepAdmit