Turn Your Bocconi Simulation Report Into a 34% Score Lift

Turn Your Bocconi Simulation Report Into a 34% Score Lift
A report simulazioni Bocconi is the result summary generated after a practice attempt at the Bocconi Test. The official Bocconi online simulation produces a Test Score Report with a total score, subject-area breakdowns, and answer counts, while platforms like Prepadmit layer on deeper diagnostics like per-question timing and skill tags. Used correctly, that data turns a single mock attempt into a targeted study plan and a measurable score gain over the following weeks.
TL;DR:
- A high number of incorrect answers suggests guessing under time pressure, which can worsen the score more than unanswered questions.
- Pay attention to section-specific mistakes, as low scores in one area often stem from content gaps, while many unanswered questions reveal pacing issues.
- Download and analyze the report promptly to identify whether your weaknesses are conceptual, careless, or timing-related before your next attempt.
- Enhanced prep platforms provide detailed diagnostics like timing, skill tags, and peer rankings to help focus study efforts more efficiently.
- Tracking your score trends over multiple attempts offers better insight into progress than focusing solely on individual test results.
Table of Contents
- What the Official Bocconi Simulation and Test Score Report Include
- What Counts as a Good Score in Your Report
- How to Turn a Report Into a Study Plan
- What Enhanced Reports From Prep Platforms Add
- How Score Scaling and Percentile Ranks Work
- Reading Reports Without Losing Your Nerve
- Official Links and Recommended Prepadmit Resources
- Get More Out of Every Mock With Prepadmit
- Sources
What the Official Bocconi Simulation and Test Score Report Include
The official simulation runs 50 questions in 75 minutes, covering areas like math, reading comprehension, numerical reasoning, and critical thinking. That timing works out to about a minute and a half per question, which is exactly why so many students run out of time before they run out of questions.
One detail trips people up every year: the public simulation does not activate the proctoring system used on the real selection test. It exists for familiarization, not as a dress rehearsal under exam-day surveillance. Treat it as practice for content and pacing, not for the webcam and ID-check routine you will face later.
Once you finish, the platform generates a Test Score Report you can download from your personal testing area. It typically includes:
- Your total score across the full test
- A breakdown by subject area
- Counts of correct, incorrect, and unanswered questions
- A 10-character alphanumeric reference number that identifies the specific attempt
Reports usually become available within 24 to 48 hours of finishing the attempt, not instantly. Plan your review session around that delay instead of refreshing the page every ten minutes.
What Counts as a Good Score in Your Report
A total score only tells half the story. What matters more is how that number was built, and whether the pattern behind it is fixable.
Your total score and your subject-area scores rarely move together in a straight line. A student who nails reading comprehension but stumbles on numerical reasoning can post a mediocre total that hides a very specific, very fixable gap. Penalties for wrong answers also drag totals down faster than skipped questions do in most scoring schemes, so a report full of guesses can score worse than one with a few honest blanks.
Pro Tip: If your report shows a high number of incorrect answers but very few unanswered questions, you’re probably guessing under time pressure rather than running out of content knowledge. Fix the clock before you fix the content.
Some prep forums circulate informal thresholds, like a minimum around 17 out of 50 in certain years, but treat those numbers as folklore, not policy. Bocconi does not publish a fixed passing score for the simulation, and admission decisions depend on the current application cycle and the specific program you’re targeting, not a single simulation total.
What you can measure reliably:
- Correct answers per section — shows where your content knowledge is solid
- Incorrect answers per section — flags concept gaps or rushed guessing
- Unanswered questions — usually a timing problem, not a knowledge problem
A report with a low total but mostly unanswered questions in one section points to a pacing fix. A report with a similar total but heavy on wrong answers points to a content fix. Same score, completely different remedy.
How to Turn a Report Into a Study Plan
Every report is a diagnostic tool, but only if you act on it within a day or two, while the questions are still fresh in your memory. Here’s a routine that works across attempts:
- Download and archive the report immediately. Save the PDF and log your total score, section scores, and the reference number in a simple spreadsheet or notebook.
- Tag every wrong or skipped question by cause. Mark each one as conceptual (you didn’t know it), careless (you knew it but rushed), or time-pressured (you ran out of clock before reaching it).
- Build a micro-practice plan around the two or three weakest tags. If numerical reasoning shows the most conceptual errors, that’s your first drill block, not a general review of everything.
- Schedule a short timed mini-mock on just the weak section within a few days, before moving to a full retake.
- Set a specific, measurable target for your next full attempt — not “do better,” but “cut unanswered questions in reading comprehension from six to two.”
If you’re six to eight weeks out from your actual test date, run a full mock roughly once a week, with shorter, skill-specific drills filling the days between. Closer to test day, shift toward timing drills over new content, since pacing under pressure is usually the last skill to solidify. A structured post-mock checklist can keep this routine consistent instead of ad hoc.
What Enhanced Reports From Prep Platforms Add
The official Test Score Report is intentionally limited. It gives you the what, but rarely why or the how fast. That gap is exactly where platforms built around richer diagnostics earn their keep.
Prep platforms like Prepadmit typically layer on:
- Per-question timing, showing exactly which items ate up your clock
- Skill tags, breaking a subject-area score into specific competencies instead of one blended number
- Percentile or peer ranking, so you know how your result compares to other test-takers, not just against an abstract scale
- Heatmaps of recurring weak spots across multiple attempts, not just one
Each diagnostic feeds directly back into the study loop. Timing data tells you which question types to practice under a stricter per-item clock. Skill tags tell you which two or three concepts, out of dozens, are actually worth your limited study hours. Educators generally recommend pairing official simulations with this kind of adaptive, timed practice, because knowing you got a question wrong matters less than knowing why and how long it took you to get there.
There’s a real trade-off here. The official simulation is free and sufficient if you only need a general sense of readiness. An enhanced platform costs money but compresses weeks of trial-and-error into a few focused study cycles, which matters more the closer you get to test day. Prepadmit’s own past-paper and correction system is built around that exact gap, and the platform reports an average score improvement of 34% among users who work through its practice modes and progress tracking. That figure is brand-reported, but it reflects the logic behind targeted diagnostics: students who know precisely what to fix, fix it faster.
How Score Scaling and Percentile Ranks Work
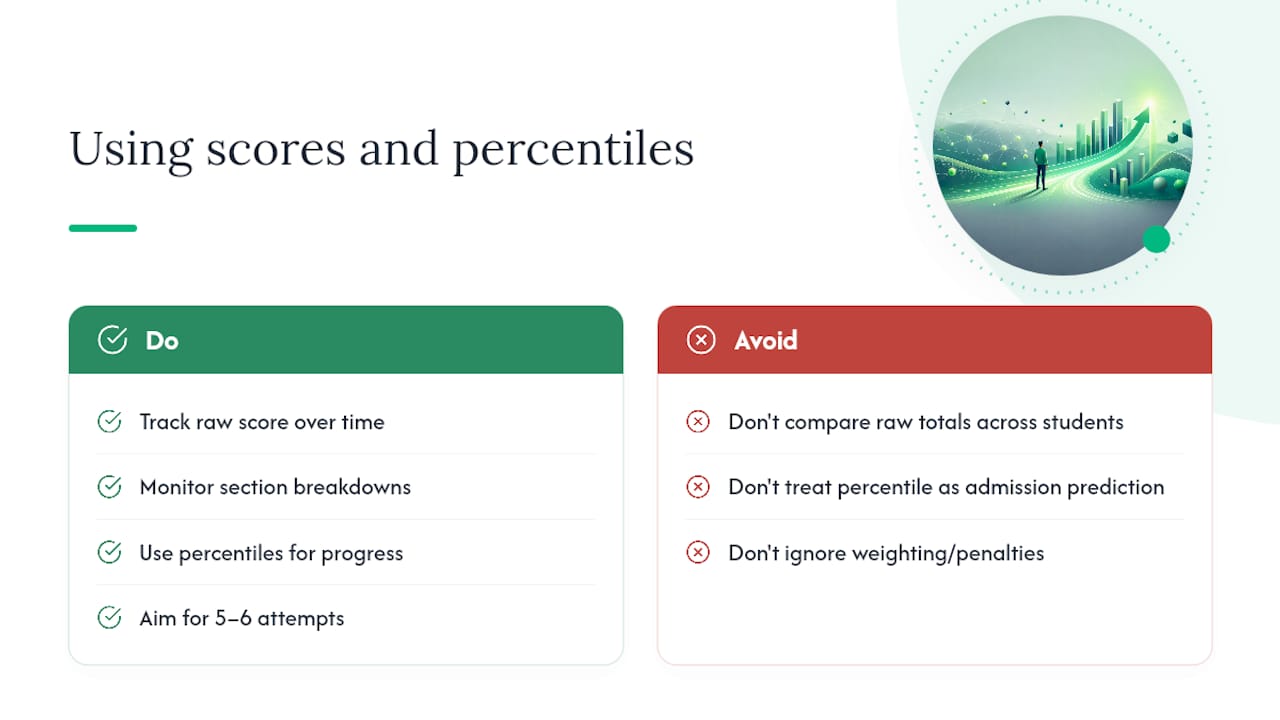
The total score on your Test Score Report reflects raw performance on that specific 50-question attempt, adjusted by whatever penalty scheme applies to wrong answers versus skipped ones. It is not automatically converted into a percentile against the full applicant pool on the official report itself. That’s a meaningful distinction: a 38 out of 50 means something different depending on how the questions were weighted and penalized that round, which is why comparing raw totals across different simulation attempts, or across different students, can be misleading without more context.
Percentile ranking, where you stand relative to other test-takers, is not a standard feature of the official simulation report. It’s one of the diagnostics that enhanced platforms tend to add, precisely because raw totals alone don’t tell you whether a 38 is exceptional or average in a given testing cycle. If a platform shows you a percentile alongside your score, treat it as a relative signal for progress tracking, not a prediction of your actual admission outcome, since real selection scoring and competition levels shift by cycle and program.
The safest way to use scaling data is longitudinally: track your own raw score and section breakdowns across five or six attempts over a few weeks. A rising trend line matters more than any single number, official or unofficial.
Reading Reports Without Losing Your Nerve
A low score on one report is a data point, not a verdict. The most useful habit you can build is treating every attempt as a map of specific gaps rather than a judgment on your ability.
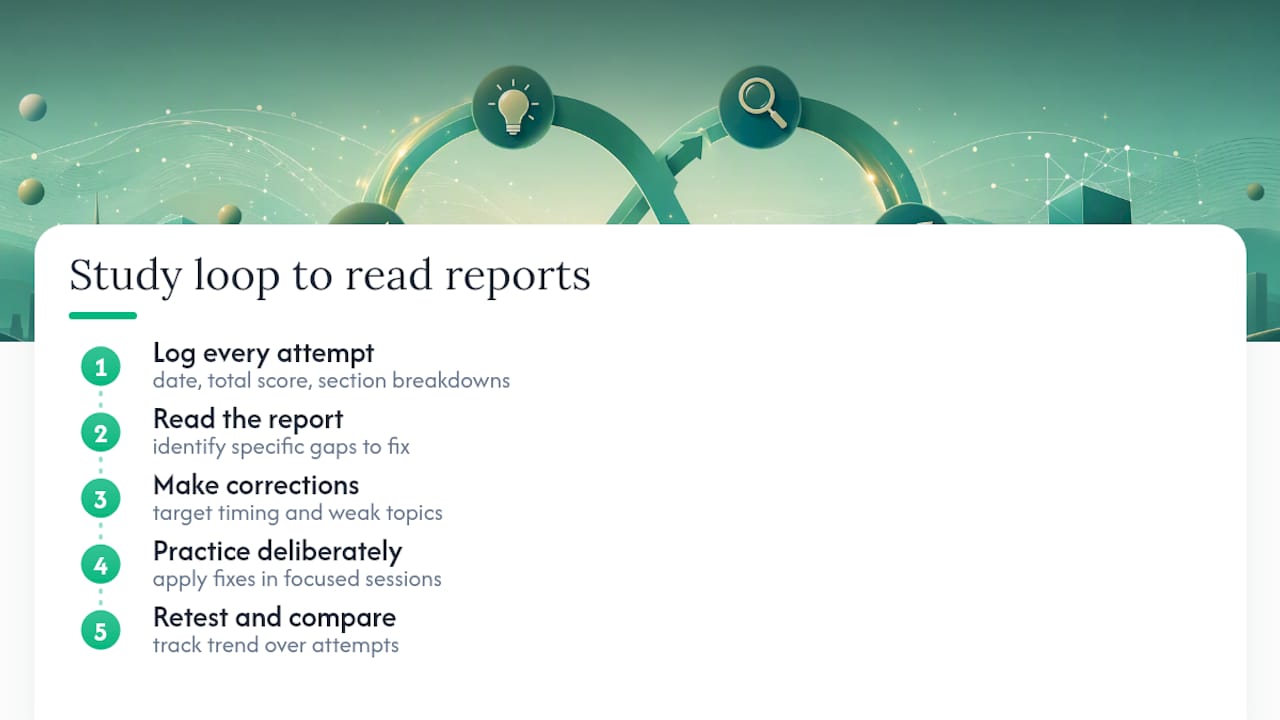
Log your results every time. A simple table with date, total score, and section breakdowns turns scattered anxiety into a visible trend line, and trend lines are far more honest than any single bad afternoon. Some students improve steadily for three attempts, plateau, then jump again once a timing fix finally sticks. That’s normal. What separates students who improve from those who stall usually isn’t raw talent. It’s whether they actually read the report closely enough to know what to fix next.
Celebrate the small, specific wins: two fewer unanswered questions, one section moving from mostly incorrect to mostly correct. Those are the signals that your study loop is working, even when the total score hasn’t caught up yet. Give the process a few full cycles, measure, correct, practice, retest, before judging whether it’s working.
— quentin
Official Links and Recommended Prepadmit Resources
Start with Bocconi’s own online simulation and Test Score Report page for structure and access details, and note that international graduate attempts run €60 each for the current cycle. For applied practice, Prepadmit’s guides on mock exam strategy and post-test actions walk through the same routine covered above in more detail.
Get More Out of Every Mock With Prepadmit
Reading an official Test Score Report tells you what happened. Prepadmit is built to help you fix it, with official past papers, skill-specific practice modes, and progress tracking that goes beyond a single total-and-breakdown PDF. It suits students who’ve already run an official simulation or two and want the per-question timing, peer ranking, and detailed corrections that turn a vague weak spot into a specific drill.
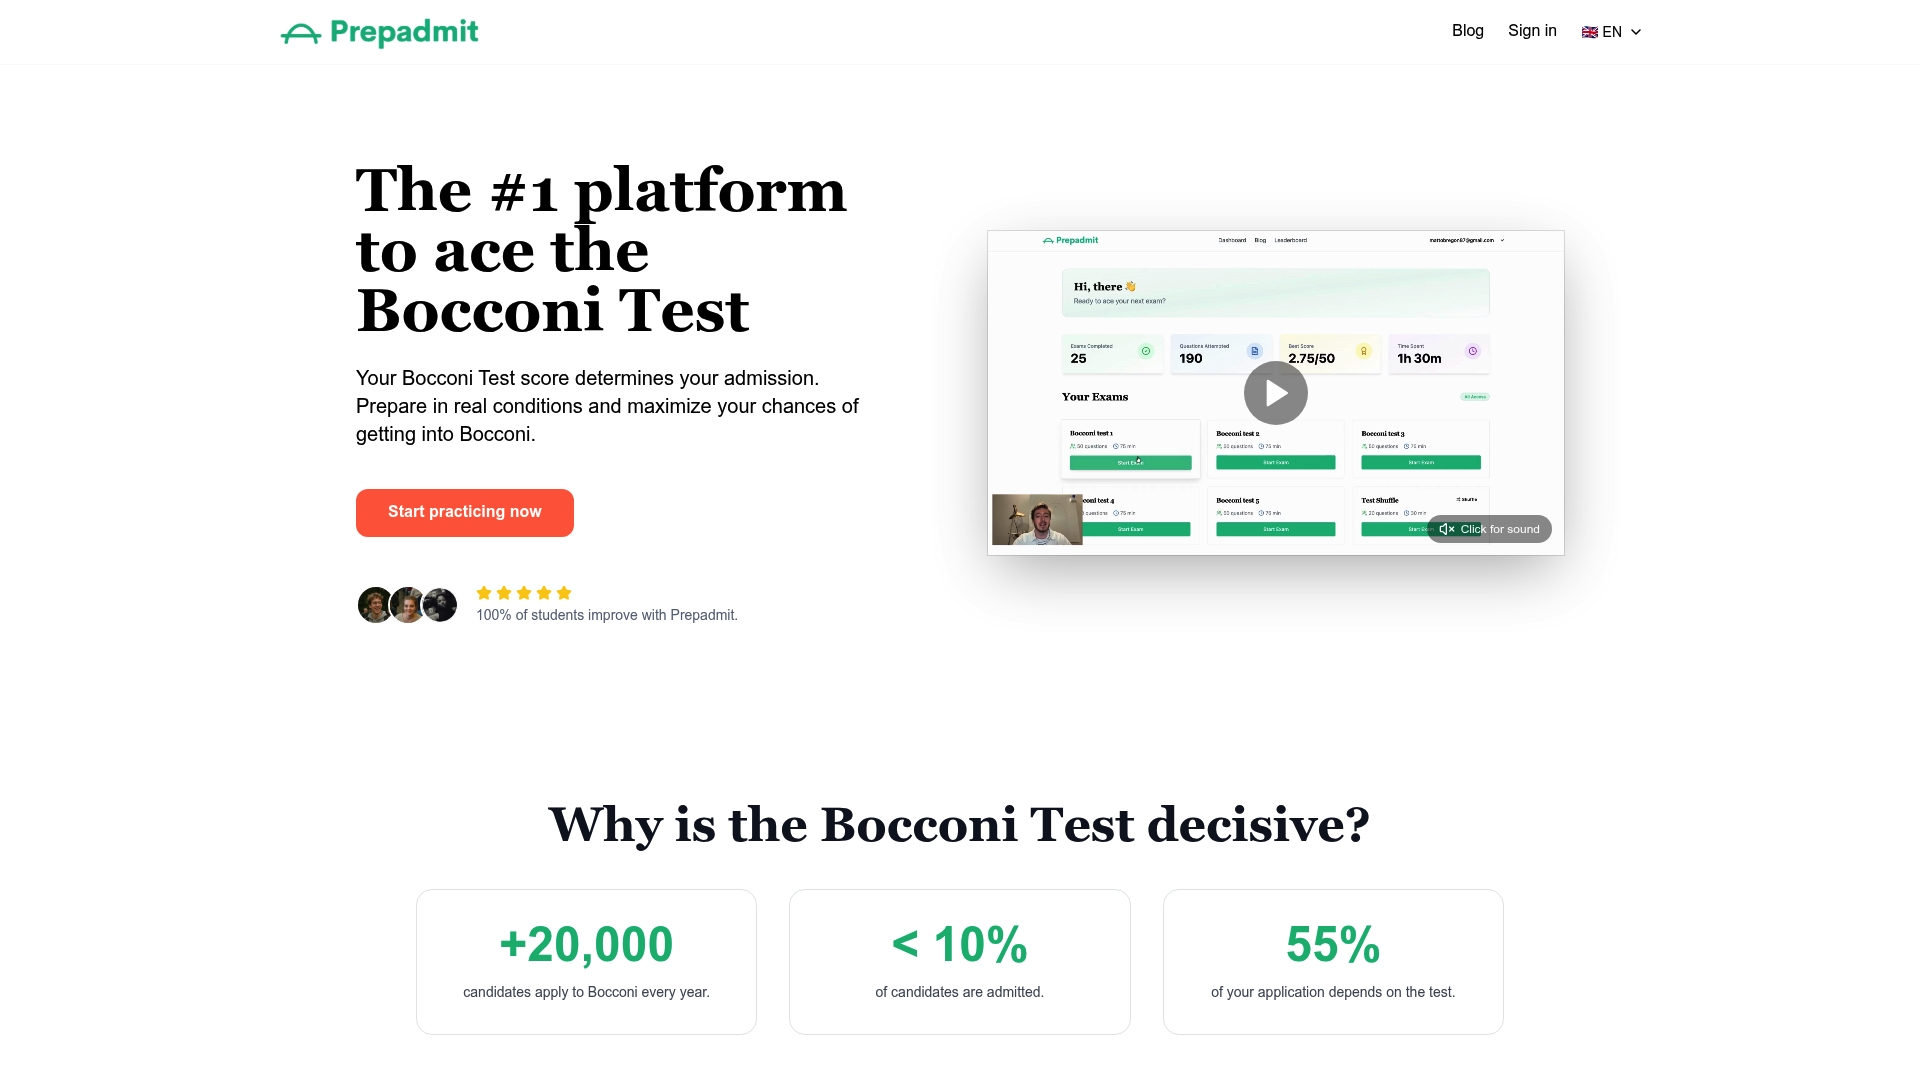
If your last report showed a pattern you don’t fully understand, that’s the kind of gap practice modes like those offered by some platforms are designed to close. Students preparing for numerical reasoning or math-heavy sections often start with the targeted MAT practice drills, then move into full timed mocks as test day approaches. Head to Prepadmit to check the current practice modules and start your next mock with a plan instead of a guess.
Recommended
Related articles
Ready to ace your admission test?
Discover PrepAdmit, the platform that helps you succeed at top university admission tests.
Discover PrepAdmit